INTC Stock Technicals Today: Gains 10.84%, Momentum Gains
On Agustus 5, 2026: price 100.86 USD, trend sideways, RSI 49.2, support 81.88, resistance 112.54. technical analysis of intc stock. INTC Stock Technicals —…

Intel is back in the middle of a volatile range, and for international investors the key question is not whether the move is dramatic, but whether it is being confirmed by the underlying trend. On NASDAQ, INTC last traded at 100.86 USD, up 10.84% in the session and 16.87% over five days, according to the exchange data cited in Yahoo Finance. That bounce matters because it has pushed the shares back above the short-term average, yet the broader structure still looks unsettled after a -8.63% one-month slide.
Trend & Price Action
The chart shows a stock trying to stabilise without fully repairing the damage done by the weaker monthly trend. Price is above the SMA20 at 98.46, which is a short-term sign that buyers have regained some control after the recent drop. But the SMA50 at 111.90 remains above the share price, so the medium-term trend has not flipped back into a clean recovery. In plain language, Intel has improved from weak to less weak, but it has not yet proven that the earlier decline is over.
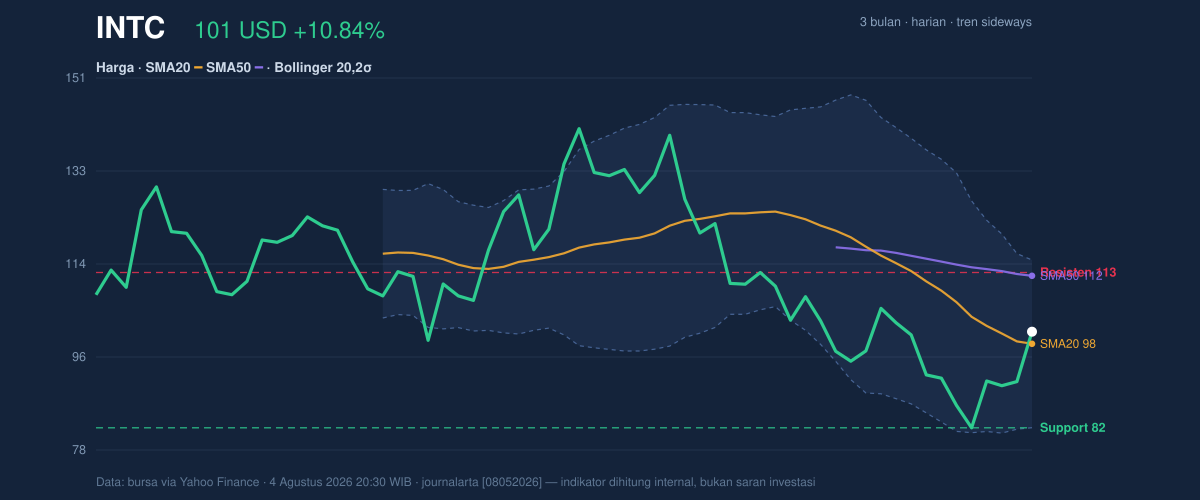
The broader trend is still described as sideways, and the SMA20 slope of -7.71% over five days shows that the recent base is not yet rising in a convincing way. That negative slope is important because it suggests the rebound is happening inside a still-soft short-term structure rather than on top of a firm uptrend. The stock is also sitting at 62% of its 20-day range, which places it in the upper half of the recent band but not near the top. That positioning usually signals recovery potential, while also leaving room for either renewed strength or another rejection.
The Bollinger setup reinforces that message. The upper band is 115.02, the middle band is 98.46, and the lower band is 81.91, with %B at 57%. That means the price is slightly above the middle of the band structure, not stretched to the upside. At the same time, the 33.6% band width shows the range has expanded, which often happens when volatility is high and traders are still repricing the stock rather than agreeing on direction.
Oscillators & Momentum
The momentum picture is more constructive than the trend picture, but only modestly so. RSI(14) at 49.2 is neutral, which means the stock is neither overbought nor oversold. That matters because it tells readers the recent rally has not yet become excessive, but it also has not generated strong momentum confirmation. In other words, the market is not showing the kind of momentum that usually accompanies a fully formed breakout.
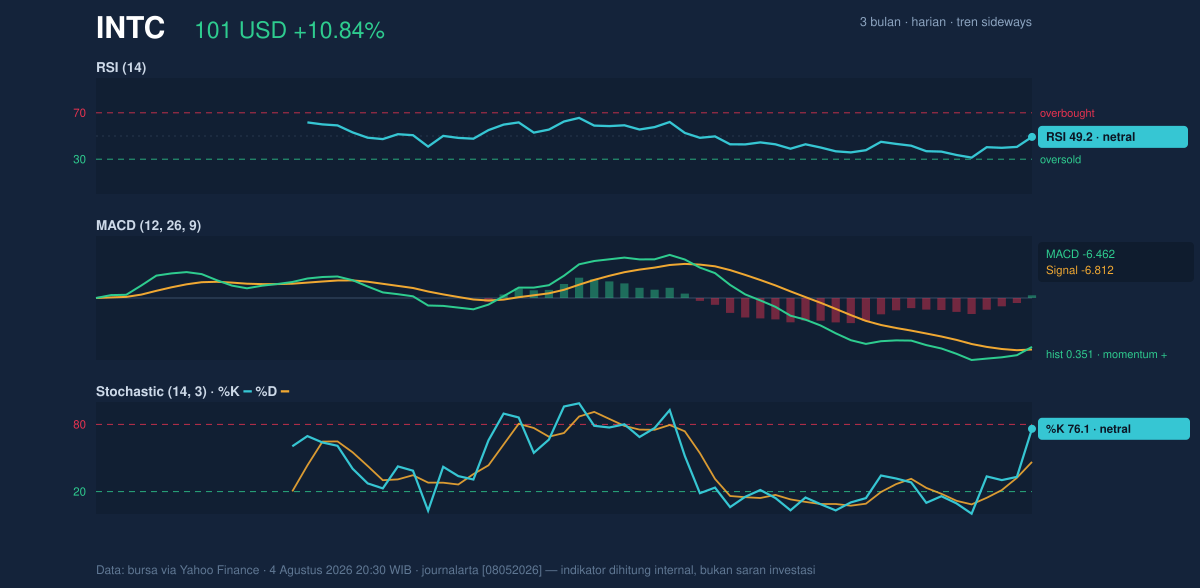
The stochastic oscillator is a little more encouraging. %K at 76.1 and %D at 46.5 suggest the short-term price has moved faster than the slower signal line, which can be an early sign of improving momentum. But because the reading is still described as neutral, it should be read as an advance in pace rather than a decisive trend signal. The MACD at -6.462 remains below zero, yet the histogram at 0.351 is positive and the MACD line is above the signal line at -6.812. That combination usually means downside momentum is easing and a rebound is trying to build, even if the stock has not fully crossed into a bullish technical regime.
Volatility & Volume
The more striking feature in this setup is volatility. ATR(14) at 7.96, or 7.9% of price, indicates that daily swings are large relative to the share price. Combined with the 33.6% Bollinger width, this says Intel is not trading quietly. For general readers, that means the stock can move quickly in either direction once a level gives way, so nearby support and resistance matter more than usual.
Volume offers a mixed confirmation. Last volume of 123,236,500 was about 1.1x normal versus the 20-session average of 116,385,755, so the rebound did attract participation. But OBV is still falling, and that is a caution flag. OBV, or on-balance volume, tracks whether trading volume is supporting price gains or losses. A falling OBV while price rises often means the rally is not yet broad-based enough to fully trust.
Key Levels & Scenarios
The nearest floor is support at 81.88, almost identical to the 3-month low of 81.79. That makes the low-80s a clear reference zone: if the stock loses that area, the recent rebound would look much less convincing. On the upside, resistance at 112.54 sits just below the SMA50 at 111.90, effectively creating a crowded ceiling around the low-110s. The 3-month high of 142.35 remains well above current levels, which shows how much ground Intel would need to recover before the chart would look genuinely strong again.
The current placement in the range suggests a conditional setup rather than a clean trend. If Intel can continue to hold above the SMA20 and work through the low-110s, the chart would start to look like a base-building attempt. If it slips back below the middle Bollinger band and loses short-term support, the recent bounce would be easier to dismiss as a relief move inside a broader consolidation.
Technical Verdict: HOLD (wait & see)
HOLD (wait & see) is the clearest technical reading because momentum is improving, but trend confirmation is still incomplete.
- Reason 1: RSI is neutral at 49.2, so the stock has room to move either way without showing a decisive momentum edge.
- Reason 2: MACD is still negative at -6.462, even though the histogram is positive at 0.351, which points to improvement rather than a full reversal.
- Reason 3: Price is above the SMA20 at 98.46 but still below the SMA50 at 111.90, leaving the chart stuck between short-term recovery and medium-term resistance.
- Verdict invalidated if price breaks below 81.88, because that would put the stock back through support and near the 3-month low.
- Ideal entry range: 98.46 to 100.86, where price is holding above the SMA20 and near the Bollinger middle band.
- Exit target: 111.90 to 112.54, where the SMA50 and resistance cluster together.
- Stop loss protection: below 81.88, using the support level that also sits near the 3-month low.
For non-traders, that means Intel has improved, but the chart still needs more proof before the rebound can be treated as durable.
Summary Data INTC
| Last price | 100.86 USD |
| Change 1 day / 5 days / 1 month | 10.84% / 16.87% / -8.63% |
| Trend / MA-cross | sideways / none |
| SMA20 / SMA50 | 98.46 / 111.90 |
| RSI (14) / Stochastic %K | 49.2 / 76.1 |
| Bollinger %B / ATR | 57% / 7.96 |
| Support / Resistance 20 days | 81.88 / 112.54 |
| Data as of | 4 Agustus 2026 20:30 WIB |



