AstraZeneca Stock Gains 4.66%, Momentum Weakens In Focus
On Agustus 6, 2026: price 12,036.00 GBp, trend downtrend, RSI 33.5, support 11,500.00, resistance 14,240.00. technical analysis of astrazeneca stock.

According to London Stock Exchange data cited via Yahoo Finance, AstraZeneca’s shares rose to 12,036.00 GBp by 14:00 WIB on 4 August 2026, rebounding 4.66% on the day after a sharp 16.21% slide over the past month. The move matters less as a one-day bounce than as a test of whether the stock can stabilise inside a broader downtrend: the price is still below the 20-day average at 12,683.80 and below the 50-day average at 13,313.24, which means recent strength has not yet changed the underlying structure. As shown in the chart, the shares are trading in the lower part of their recent range, with momentum and trend signals still pointing in different directions.
Trend & Price Action
The price structure remains weak. The stock is in a downtrend, and the SMA20 slope of -3.64% over five days shows that the short-term trend is still leaning lower rather than flattening out. In plain terms, the recent bounce has not yet been strong enough to reverse the pressure from sellers. There is also no fresh MA-cross, so the chart does not yet show the kind of moving-average turn that often marks a trend change.
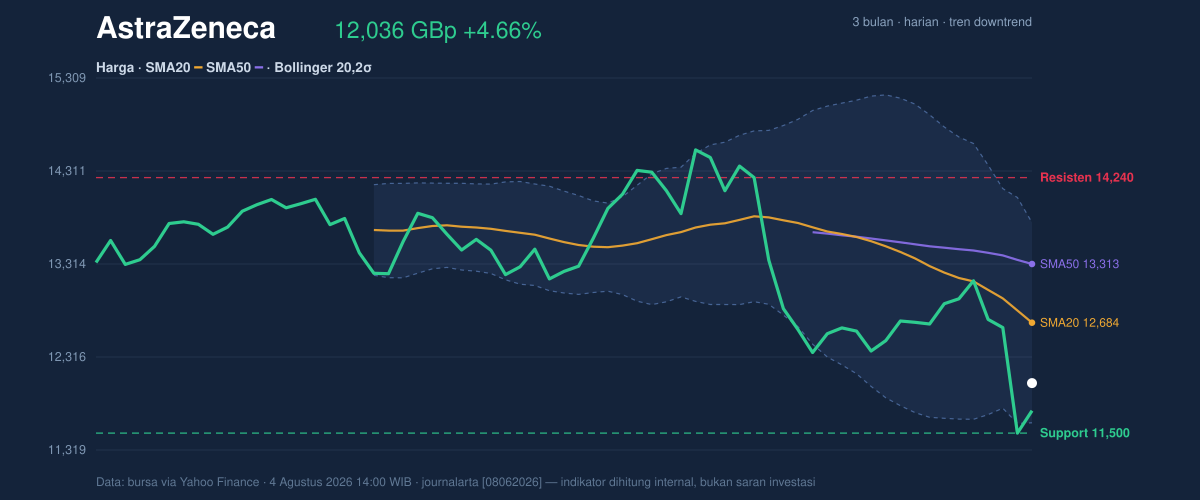
Positioning within the Bollinger Bands adds another layer. The shares are sitting near the lower part of the band structure, with %B at 20%, which means price is close to the lower band rather than the middle of the range. That does not automatically imply a rebound, but it does signal that the market has already priced in a meaningful amount of weakness. The bands are normal at 16.9% width, so this is not a violent squeeze that would usually foreshadow an explosive breakout. Instead, the chart suggests a market that is still digesting a prior decline.
Oscillators & Momentum
Momentum is mixed, but not supportive enough to confirm a recovery. RSI at 33.5 is technically still in neutral territory, yet it is close to the oversold boundary, which tells readers that bearish pressure has been heavy without reaching a full capitulation signal. The Stochastic %K at 46.1 and %D at 59.6 are also neutral. That matters because Stochastic tends to move faster than RSI; here, it is not showing a clear reversal impulse, only a partial easing of downside momentum.
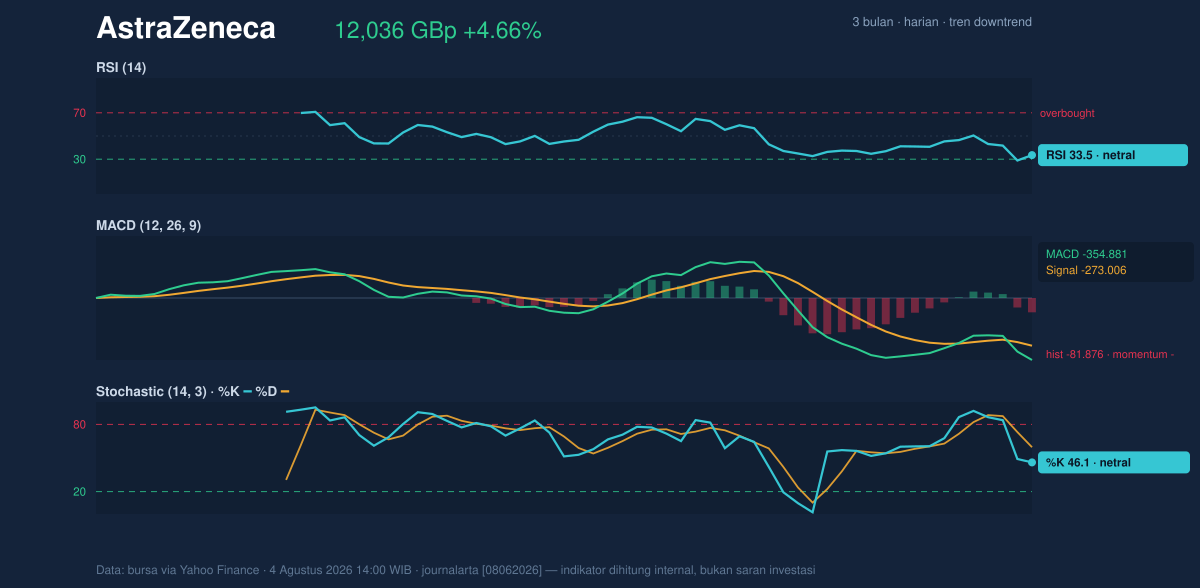
The more important signal comes from MACD. MACD at -354.881, below the signal line at -273.006, with a histogram of -81.876, shows that downside momentum is still negative. In practical terms, the stock may be bouncing, but the trend engine underneath remains bearish. That kind of setup often produces rallies that fade unless the MACD begins to narrow materially and move back toward its signal line.
Volatility & Volume
Trading activity has increased sharply, which is often a sign that the market is engaged rather than indifferent. Last volume of 7,393,774 was about 1.9 times the 20-day average of 3,798,453. That is a meaningful participation spike. The catch is that OBV is falling, so the heavier trading has not yet translated into sustained accumulation. In other words, volume is confirming that the move matters, but not yet confirming that buyers are in control.
Volatility is also elevated. ATR at 540.65, or 4.5% of price, means daily swings remain wide enough to punish weak entries and fast reactions. For general readers, ATR is a measure of typical price movement; a higher reading means the stock can travel farther in either direction before settling. That makes nearby support and resistance levels more important than usual, because the market has room to move quickly through them.
Key Levels & Scenarios
The nearest reference points are clear. Support sits at 11,500.00, while resistance is 14,240.00. The current price is closer to support than resistance and sits at the 20% point of the range, which keeps the stock in the lower quarter of its recent trading band. That positioning is consistent with a market still under pressure, even after the day’s rebound. The broader 3-month high of 15,126.00 and 3-month low of 9,892.00 show that the stock has already absorbed a sizeable move in both directions this year, but the present setup is still defined by whether support can hold.
If 11,500.00 gives way, the chart would be signalling that the recent bounce has failed to build a base, and sellers would likely keep control. If price can reclaim the 12,683.80 middle Bollinger band and then the 13,313.24 50-day average, the tone would improve materially because that would show the stock moving back through the layers that currently cap it. Until then, the market is asking whether this is a pause in a decline or the start of a repair.
Technical Verdict: HOLD (wait & see)
HOLD (wait & see) fits the current chart because the rebound is real, but the trend is still down and the momentum picture has not turned decisively positive.
- Reason 1: Price remains below SMA20 at 12,683.80 and SMA50 at 13,313.24, so the moving-average structure still points lower.
- Reason 2: MACD is negative and below its signal line, which means downside momentum has not fully exhausted itself.
- Reason 3: Volume is 1.9× average, but OBV is falling, so participation has not yet translated into accumulation.
- Invalidation: This verdict is invalidated if price falls below 11,500.00, because that would break the nearest support and weaken the case for stabilisation.
- Ideal Entry Range: 11,610.30 to 12,683.80
- Exit Target (Target Price): 13,313.24 to 14,240.00
- Stop Loss protection: Below 11,500.00
For non-traders, this means the shares have bounced, but the chart still needs proof that the downtrend is ending.
Volume last traded: 7,393,774 shares versus a 20-day average of 3,798,453.
Summary Data AstraZeneca
| Last price | 12,036.00 GBp |
| Change 1 day / 5 days / 1 month | 4.66% / -6.99% / -16.21% |
| Trend / MA-cross | downtrend / none |
| SMA20 / SMA50 | 12,683.80 / 13,313.24 |
| RSI (14) / Stochastic %K | 33.5 / 46.1 |
| Bollinger %B / ATR | 20% / 540.65 |
| Support / Resistance 20 days | 11,500.00 / 14,240.00 |
| Data as of | 4 Agustus 2026 14:00 WIB |



