BP Golden Cross Formed: Stock Drops 6.74% (Agustus 6, 2026)
On Agustus 6, 2026: price 514.90 GBp, trend sideways, RSI 50.5, support 481.80, resistance 555.90. technical analysis of bp stock. BP Golden Cross Formed —…

BP plc is caught between a softer one-day selloff and a still-constructive medium-term setup, with the shares trading below short-term average price but above longer-term support on the London market.
BP.L last changed hands at 514.90 GBp on the LSE, down 6.74% from the previous close of 552.10, according to market data via Yahoo Finance at 4 August 2026 14:00 WIB. The sharp daily drop matters less as a standalone number than as a signal: it shows sellers were in control in the latest session, but the broader structure has not fully broken. Over one month, the shares are still up 8.50%, which suggests the recent weakness is a pullback inside a larger rebound rather than a clean trend reversal.
Trend & Price Action
The chart shows BP in a sideways pattern, which usually means the market is waiting for a clearer catalyst before committing to a stronger direction. Price is sitting below the SMA20 at 524.15 but above the SMA50 at 513.33. That positioning is important: it tells investors the stock has slipped under its near-term trend line, yet it remains just above a slower-moving base that often acts as a floor.
The moving average picture is still not bearish in the classic sense because the chart shows a golden cross, with the SMA20 crossing above the SMA50. In plain English, that is a medium-term bullish signal: recent prices have been strong enough to lift the short average above the longer one. But the fact that the share price is now below the SMA20 means that bullish signal is being tested. The market is not rejecting the trend, but it is no longer confirming it with momentum.
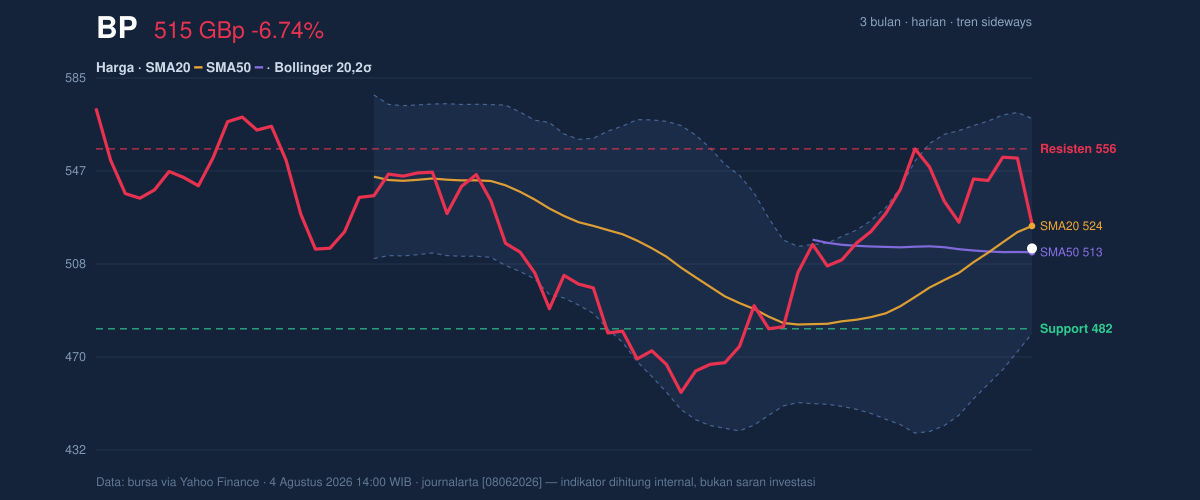
BP is also trading in the lower half of its recent range. The 20-day support at 481.80 and 20-day resistance at 555.90 frame the current battle. At 45% of the range, the share price is not near the top of the band where buyers usually feel in control, but neither is it pressing the floor. The stock remains inside the broader 3-month range of 450.60 to 580.60, which reinforces the idea of consolidation rather than trend breakdown.
Oscillators & Momentum
The momentum signals are mixed, which fits the sideways trend. RSI at 50.5 is almost exactly neutral. That means BP is neither overbought nor oversold; the market is balanced, and there is no strong momentum extreme to argue for a crowded move in either direction. The Stochastic reading of %K 36.9 versus %D 73.7 is more cautious. This shows short-term momentum has cooled from a stronger position and is now lagging its signal line, a sign that the recent rally has lost some pace.
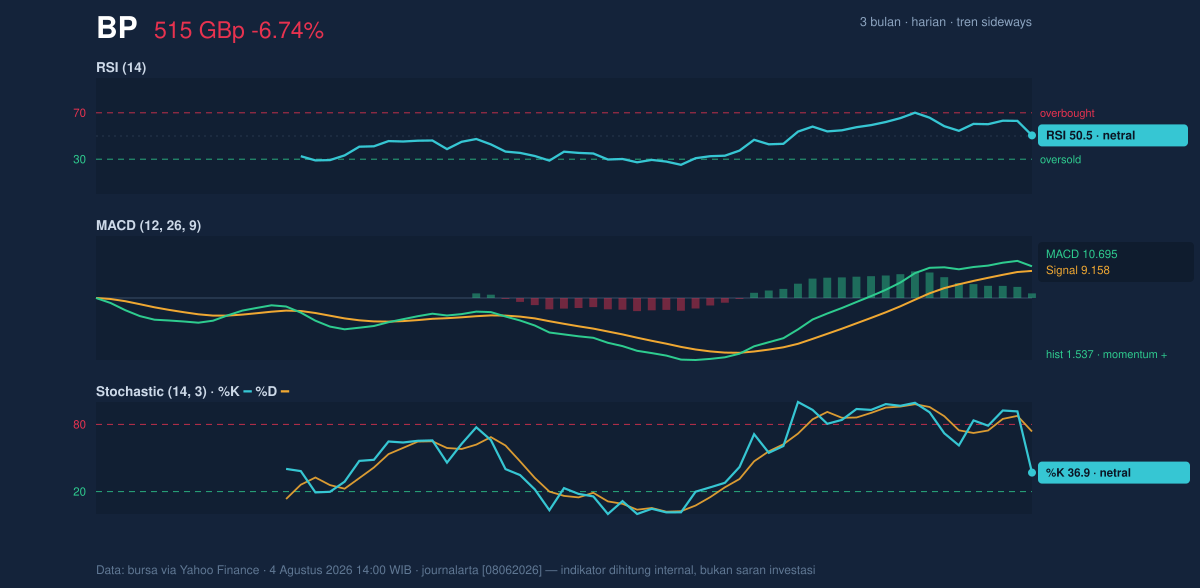
MACD is the one indicator still leaning positive. The MACD at 10.695 sits above the signal line at 9.158, with a positive histogram of 1.537. That combination usually means upward momentum still exists beneath the surface, even if it is not strong enough to overpower the latest selloff. In other words, the trend has not turned decisively lower; it has merely stalled and needs fresh buying to reassert itself.
Volatility & Volume
Bollinger Bands add another layer to the story. The band width is 16.9%, described as normal, so this is not a compression setup likely to explode immediately, nor an unusually wide and unstable market. The %B at 40% shows the stock is trading below the midline of the band and closer to the lower half than the upper, which is consistent with a market that has weakened but not yet reached an oversold extreme. The middle band at 524.15 also lines up with the SMA20, so reclaiming that level would matter technically because it would restore the short-term trend reference.
Volume tells a more nuanced story. The latest turnover of 70,448,049 was about 1.7× the 20-day average of 42,096,797, which means the selloff was not a thin, low-conviction move. Heavy volume on a down day often signals real participation, not just noise. At the same time, OBV is down, which indicates the balance of accumulated volume has been drifting away from the stock. That divergence is worth watching: price can sometimes bounce before OBV turns, but declining OBV usually warns that rallies may struggle to sustain without broader demand.
Key Levels & Scenarios
The immediate technical map is clear. 481.80 is the first support to watch, and it sits not far above the 3-month low of 450.60. If that support fails, the chart would start to lose the base that has contained the stock over the recent period. On the upside, 524.15 is the first reclaim level because it matches both the SMA20 and the Bollinger midline, while 555.90 is the next resistance and the point where the latest rebound would need to prove it can extend beyond a routine bounce.
The signal mix suggests BP is not in a clean trend phase. The golden cross and positive MACD argue that the medium-term structure remains healthier than the one-day drop implies, but the price sitting below the SMA20 and the falling OBV show that buyers have not yet regained full control. The core message from the chart is that BP is still technically intact, but it needs to recover the 524.15 area to show that the recent weakness is only a pause, not the start of a deeper fade.
Technical Verdict: HOLD (wait & see)
HOLD (wait & see)
- Reason 1: Golden cross + positive MACD keep the medium-term structure constructive.
- Reason 2: Price below SMA20 at 524.15 shows near-term momentum has weakened.
- Reason 3: RSI 50.5 and normal Bollinger width point to a neutral, range-bound setup rather than a decisive breakout.
- Verdict invalidated if price falls below 481.80, where the nearest support and recent range floor would be under pressure.
- Ideal Entry Range: 481.80 to 513.33
- Exit Target: 524.15, then 555.90
- Stop Loss protection: below 481.80
In plain English, BP is not flashing a clear trend signal yet, so the chart is saying “wait for confirmation” rather than forcing a decision today.
Summary Data BP
| Last price | 514.90 GBp |
| Change 1 day / 5 days / 1 month | -6.74% / -2.05% / 8.50% |
| Trend / MA-cross | sideways / golden |
| SMA20 / SMA50 | 524.15 / 513.33 |
| RSI (14) / Stochastic %K | 50.5 / 36.9 |
| Bollinger %B / ATR | 40% / 16.40 |
| Support / Resistance 20 days | 481.80 / 555.90 |
| Data as of | 4 Agustus 2026 14:00 WIB |



