DBS Stock Analysis: Drops 1.21%, RSI Overbought
On Agustus 6, 2026: price 73.55 SGD, trend uptrend, RSI 71.7, support 69.10, resistance 75.00. technical analysis of dbs stock. DBS Stock Analysis — full…

DBS Group’s shares slipped 1.21% to SGD 73.55 as of 4 August 2026, 08:00 WIB, easing after a strong one-month gain of 7.15%. The move leaves the stock still above its short- and medium-term trend lines, but the tape is now showing a familiar tension: price remains in an uptrend, yet momentum indicators are flashing that the advance may have travelled a little too far, too fast.
Trend & Price Action
The broad structure is still constructive. DBS is trading above its SMA20 at 72.81 and well above the SMA50 at 67.94, which tells investors the stock is holding its recent gains and remains above the average price paid over both the past month and the past quarter. The SMA20 slope of 2.73% over 5 days reinforces that the short-term trend is still rising, even after the latest pullback.
There is no fresh moving-average crossover to point to a new trend shift, which matters: the current setup is not a breakout from a fresh technical trigger, but an established uptrend trying to digest gains. As shown in the chart, price is also sitting in the upper part of its recent range, with the stock at 75% of the 20-day range. That usually signals strength, but it also means less room before the next ceiling becomes relevant.
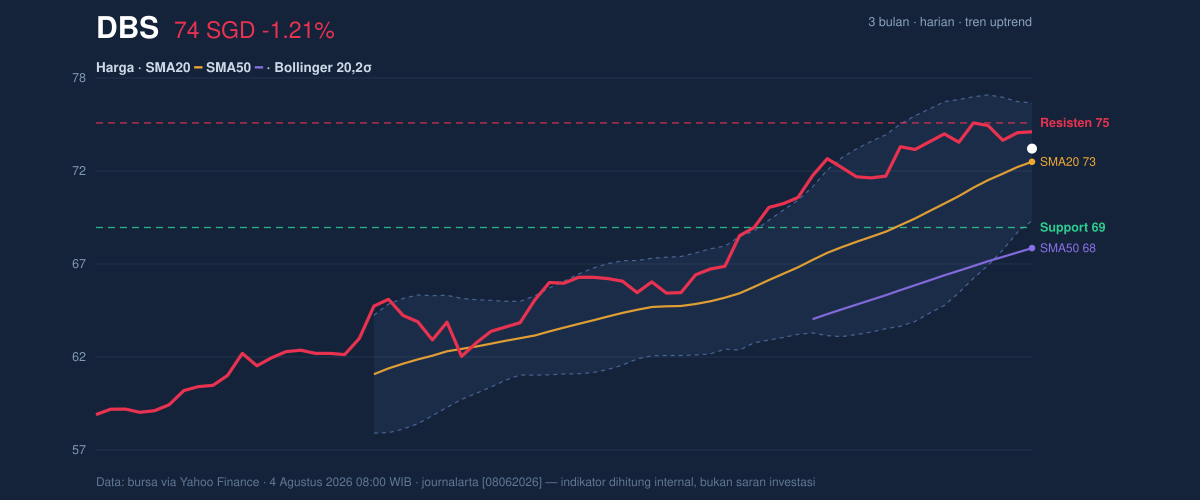
The key near-term reference is clear: SGD 75.00 remains the first resistance, while SGD 69.10 is the nearest support. The stock is not far from the top of its 3-month high/low range of 75.00 / 58.05, which suggests the market is testing the upper boundary of the recent trading band rather than building a fresh base.
A short pause after a strong climb is not unusual.
Oscillators & Momentum
This is where the picture turns less comfortable. The RSI at 71.7 is in overbought territory, meaning the stock has risen quickly enough that buying pressure may be stretched in the short term. The Stochastic oscillator at 86.2 / 83.3 is also overbought, which often indicates price is near the upper end of its recent range and vulnerable to consolidation or a brief reversal.
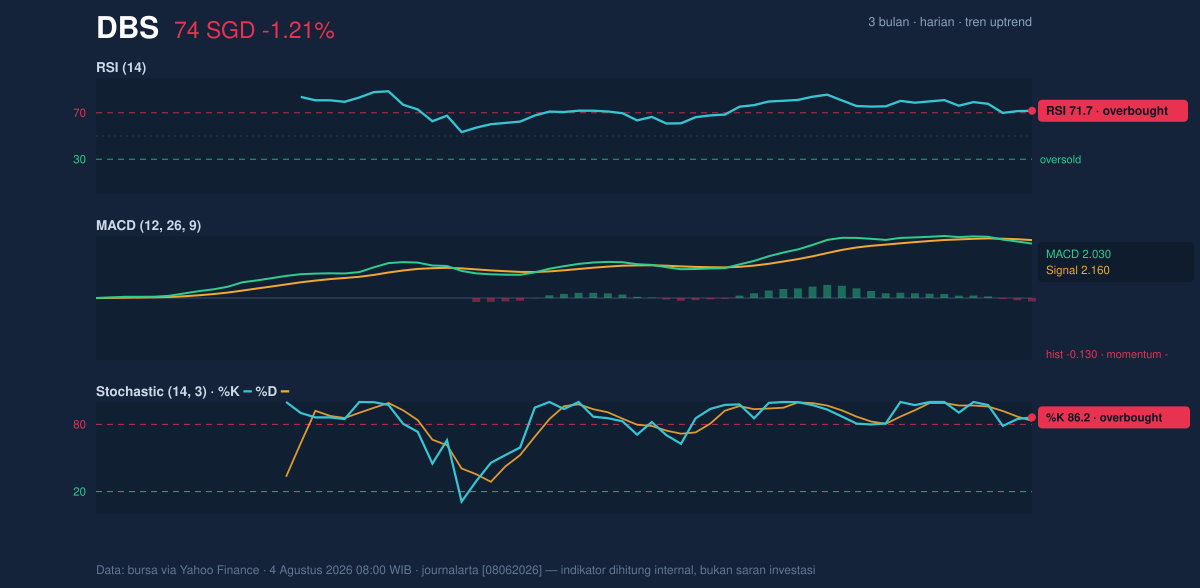
The more important signal is that momentum is no longer fully confirming price. The MACD at 2.030 remains positive in absolute terms, but it sits below the signal line at 2.160, with a -0.130 histogram. In plain language, that means the trend is still up, but the rate of acceleration has softened. When MACD turns negative while RSI and Stochastic are already overbought, it often suggests the market is entering a digestion phase rather than launching immediately higher.
That does not automatically mean a trend break. It means the stock is no longer climbing with the same urgency.
Volatility & Volume
Volatility is subdued. The ATR(14) at 1.10, equal to about 1.5% of price, points to relatively low day-to-day movement for now. That matters because low ATR often compresses the market into a tighter range before a larger move emerges. The Bollinger Bands are not signaling an extreme squeeze, though: the 9.1% band width is described as normal, which suggests the stock is neither unusually compressed nor unusually expanded.
The price is also trading above the Bollinger midline at 72.81, with %B at 61%. That means DBS is in the upper half of its band but not pressed against the top rail at 76.13. In practical terms, the stock still has room to extend, but the overbought oscillators imply that any push higher may need stronger follow-through than the market has recently shown.
Volume adds a subtle confirmatory note. Last trade volume of 4,901,500 was about 1.1× the 20-session average of 4,471,817, and OBV is rising. OBV, or on-balance volume, tracks whether volume is supporting price direction. A rising OBV alongside an uptrend usually means buyers are still participating, even if momentum has cooled. That is a healthier sign than a price rise on fading volume.
Key Levels & Scenarios
The immediate map is straightforward. SGD 75.00 is the key upside barrier, and a clean move above it would place the stock into fresh high ground within the current 3-month range. On the downside, SGD 72.81 — the SMA20 and Bollinger midline — is the first technical line of defense. If that gives way, attention shifts to SGD 69.49, the lower Bollinger band, and then SGD 69.10, the nearest support from the 20-session range.
Because the stock is already near the top of its recent band, the market is likely to treat SGD 75.00 as a decision point rather than a casual checkpoint. A failure to clear it could invite profit-taking. A hold above SGD 72.81 would keep the trend intact.
Technical Verdict: HOLD (wait & see)
HOLD (wait & see)
- RSI at 71.7 and Stochastic at 86.2 / 83.3 show the stock is overbought, which limits immediate upside momentum.
- MACD at 2.030 below the signal line at 2.160 with a -0.130 histogram shows momentum is weakening even though the broader trend remains up.
- Price above SMA20 at 72.81 and SMA50 at 67.94, plus OBV rising, means the uptrend is still intact and not broken.
- Verdict invalidated if price falls below SGD 69.10.
Ideal levels based strictly on the chart:
- Entry Range: SGD 72.81 to SGD 73.55
- Exit Target (Target Price): SGD 75.00 to SGD 76.13
- Stop Loss protection: below SGD 69.10
In plain English: DBS still looks technically healthy, but the stock is now close enough to resistance that the market is asking for proof before extending the rally.
“The trend is still alive — but the next move needs to earn its keep.”
Summary Data DBS
| Last price | 73.55 SGD |
| Change 1 day / 5 days / 1 month | -1.21% / -0.49% / 7.15% |
| Trend / MA-cross | uptrend / none |
| SMA20 / SMA50 | 72.81 / 67.94 |
| RSI (14) / Stochastic %K | 71.7 / 86.2 |
| Bollinger %B / ATR | 61% / 1.10 |
| Support / Resistance 20 days | 69.10 / 75.00 |
| Data as of | 4 Agustus 2026 08:00 WIB |



