Golden Cross Formed, AIA Stock Drops 1.02% Today
On Agustus 6, 2026: price 77.75 HKD, trend uptrend, RSI 56.0, support 72.30, resistance 79.65. technical analysis of aia stock. Golden Cross Formed — full…

AIA Group closed at HKD 77.75, down 1.02% on the day, but the tape still sits inside a constructive medium-term structure. The stock is trading above SMA20 at 76.44 and above SMA50 at 76.16, while the chart shows a golden cross — the shorter average has moved above the longer one. That matters because it usually marks a shift from recovery to trend confirmation, not just a one-day bounce. The move, however, has not been backed by heavy participation: volume came in at 17,983,851, below the 20h average of 22,360,063, and OBV is down, a sign that some traders are still not fully committing to the advance.
Trend & Price Action
As shown in the chart, AIA is still in an uptrend, with the SMA20 slope at 1.97% over 5 days. That slope is important: it suggests the recent rise has momentum, not just a flat consolidation. The price is also positioned in the upper part of its recent trading band, at about 74% of the 20-hour range, which tells us the market is closer to the upper boundary than the lower one. In practical terms, buyers have been able to defend the area around the moving averages, but the stock has not yet forced a decisive break above nearby resistance.
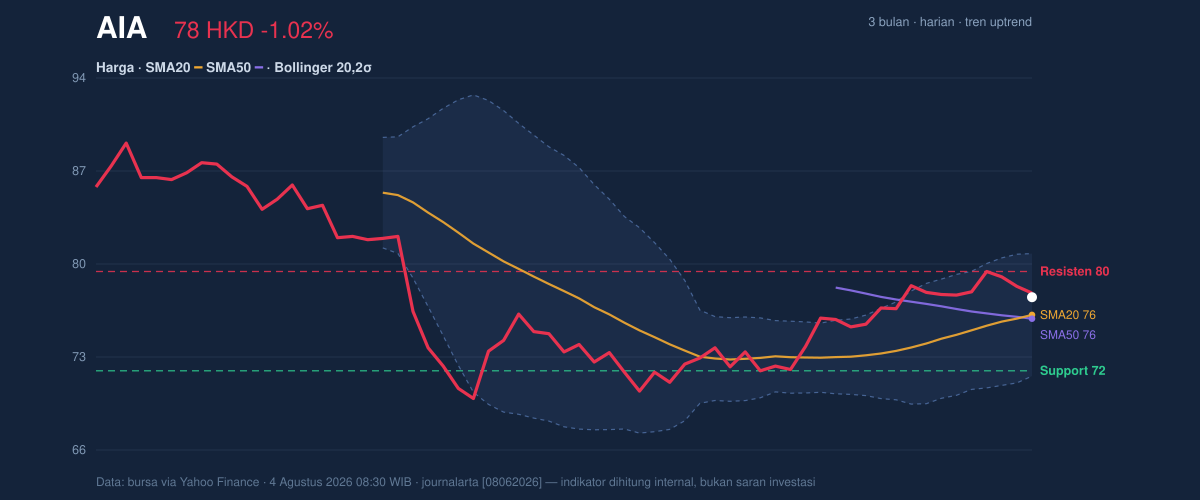
The broader range gives that context more weight. AIA is still below the 3-month high of 89.95, but comfortably above the 3-month low of 69.05. That places the shares in the middle-to-upper portion of the recent three-month corridor. The immediate battleground is clear: support at 72.30 and resistance at 79.65. A close above resistance would signal that the recent uptrend is moving from recovery into expansion. Failure to hold the support zone would instead imply the rally is losing traction and reverting toward the moving-average base.
Oscillators & Momentum
The momentum picture is positive, but not stretched. RSI at 56.0 is neutral, which means the stock is neither overbought nor oversold. That is usually a healthy place for an uptrend to pause, because it leaves room for further gains without immediately triggering exhaustion signals. The Stochastic %K at 63.5 and %D at 74.9 are also neutral, though the gap between them suggests near-term momentum has cooled a little from its recent highs. That is not a bearish reversal by itself; it is more consistent with a stock that has advanced enough to need consolidation.
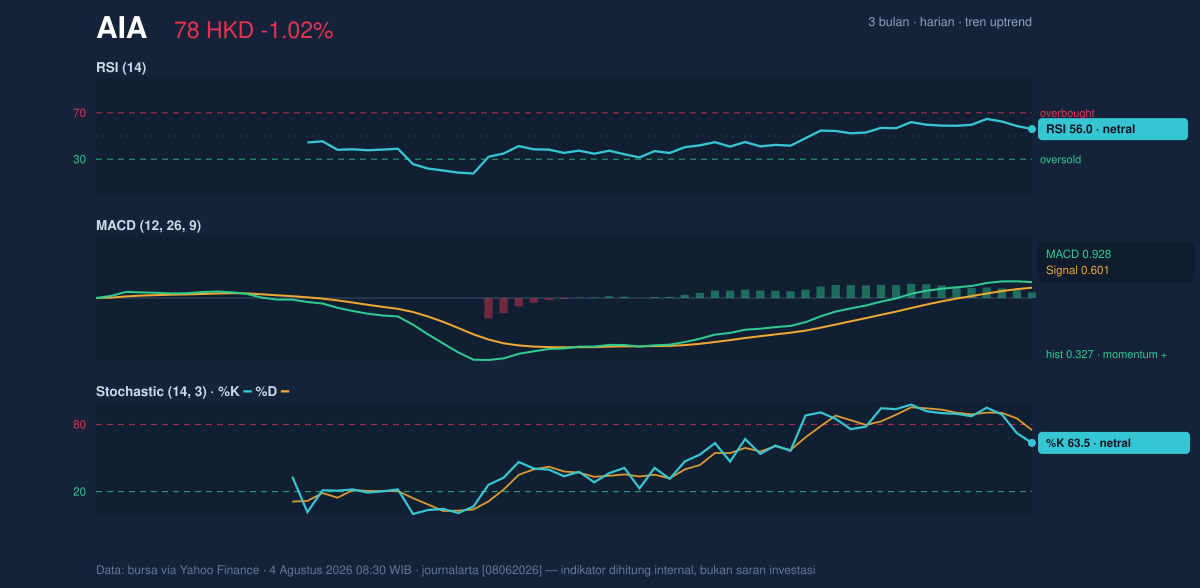
The stronger message comes from MACD at 0.928, above its signal line at 0.601, with a positive histogram of 0.327. For non-specialists, that means the trend’s internal momentum is still pointing upward: the faster trend measure remains ahead of the slower one, and the gap between them is positive. In plain language, the trend is still supported by price acceleration, even though oscillators are no longer in the early breakout stage. That combination often appears when a stock is moving in a measured advance rather than a speculative surge.
Volatility & Volume
Volatility is moderate. ATR(14) at 1.77, equal to 2.3% of price, implies normal daily movement rather than a turbulent tape. The Bollinger Band structure reinforces that reading. The band width is 11.9%, described as normal, which means there is no squeeze that would hint at an imminent explosive move, and no expansion that would suggest panic or euphoria. The price sits at %B 64%, above the midpoint of the band but not near the top edge. That placement matters: it shows the stock is trading with a mild upward bias, yet it is not so extended that mean reversion is automatically looming.
The volume profile, though, is the caution flag. Last trade volume was only 0.8× normal, and OBV is down. That combination means the latest price progress has not been fully confirmed by broad accumulation. In technical terms, the chart is saying buyers are present, but not forceful. A move higher can still continue, but it would be healthier if participation improved on the next push toward resistance.
Key Levels & Scenarios
The chart points to a fairly clean setup. Support at 72.30 aligns with the lower side of the recent range and sits below the moving-average cluster, making it the first line of defense. SMA20 at 76.44 and SMA50 at 76.16 now act as nearby trend support. On the upside, 79.65 is the first resistance to watch, with the Bollinger upper band at 80.97 marking the next technical ceiling if momentum improves.
If price holds above the moving averages and pushes through 79.65, the chart would suggest a stronger continuation phase, especially if volume rises above the current sub-normal level. If price slips back under the 76.16–76.44 zone, the golden-cross benefit starts to fade and the market would likely be seen as consolidating rather than trending. A break below 72.30 would be more damaging, because it would cut through the visible support shelf and signal that the recent advance has lost its base.
Technical Verdict: HOLD (wait & see)
HOLD (wait & see)
- MACD remains positive at 0.928 versus 0.601, so the underlying trend is still constructive.
- Price is above SMA20 and SMA50, and the golden cross supports the broader uptrend.
- Volume is below average and OBV is down, which weakens confirmation for a fresh breakout.
- Verdict invalidated if price breaks below 72.30.
- Ideal Entry Range: 76.16 to 76.44, where the moving averages cluster
- Exit Target: 79.65, with 80.97 as the upper Bollinger reference
- Stop Loss protection: 72.30
For non-traders, the chart says AIA is still in an uptrend, but it has not yet proved that the next leg higher is backed by strong enough demand.
Summary Data AIA
| Last price | 77.75 HKD |
| Change 1 day / 5 days / 1 month | -1.02% / -0.19% / 7.09% |
| Trend / MA-cross | uptrend / golden |
| SMA20 / SMA50 | 76.44 / 76.16 |
| RSI (14) / Stochastic %K | 56.0 / 63.5 |
| Bollinger %B / ATR | 64% / 1.77 |
| Support / Resistance 20 days | 72.30 / 79.65 |
| Data as of | 4 Agustus 2026 08:30 WIB |



