HSBC Stock Drops 3.63%, RSI Overbought In Focus
On Agustus 6, 2026: price 162.10 HKD, trend uptrend, RSI 73.3, support 151.90, resistance 168.20. technical analysis of hsbc stock. HSBC Stock Drops — full…

HSBC Holdings traded at 162.10 HKD on HKEX, down 3.63% from the prior close of 168.20, but the pullback sits inside a broader uptrend rather than breaking it. The share price remains above the 20-day SMA at 159.31 and well above the 50-day SMA at 151.48, which tells the market is still pricing in a constructive intermediate-term structure even after a sharp one-day reversal. What matters now is not the red candle itself, but whether that dip is just a pause after a strong run or the first sign that momentum is tiring near the top of the recent range.
Trend & Price Action
The chart shows HSBC still leaning upward, with the SMA20 slope rising 2.49% over 5 days. That kind of slope matters because it suggests the short-term trend is not flat; it is still climbing, which often means buyers are stepping in on weakness rather than waiting for deep discounts. The absence of a new MA-cross also matters: there is no fresh bearish crossover between the short and longer averages, so the trend structure has not been formally damaged. Price is also sitting in the upper part of its recent band, at 63% of the 20-hour range, which shows the market is still trading closer to the top than the middle of its recent corridor.
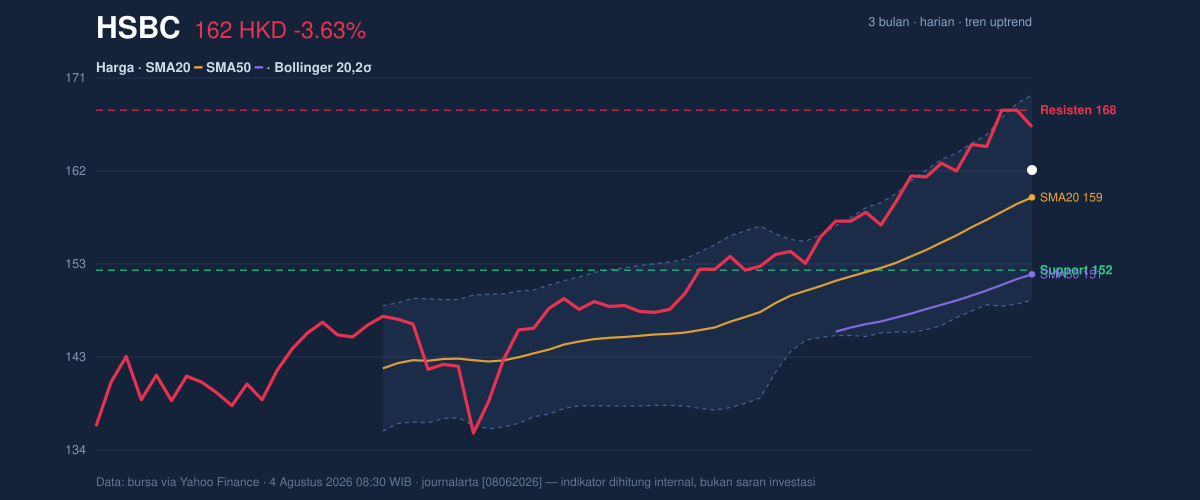
The key message from the price structure is simple: HSBC is not in breakdown territory, but it is pressing against a zone where momentum has to prove itself again. The 20-hour resistance at 168.20 lines up closely with the recent high, while the 20-hour support at 151.90 sits near the 50-day average, creating a clear technical frame. A move back above the recent high would confirm that the dip was absorbed; failure to hold the support area would shift the story toward consolidation.
Oscillators & Momentum
Momentum is where the picture becomes more nuanced. The RSI(14) at 73.3 is in overbought territory, which does not mean the stock must fall immediately, but it does mean the rally has already traveled far enough that fresh buyers may be more cautious. In plain language, RSI above 70 often signals that the market has been pushed hard in one direction and may need to cool off before extending further. That warning is partly offset by the MACD reading of 4.710 above its signal line at 4.164, with a positive histogram of 0.546. This is a bullish confirmation signal: MACD is still saying upside momentum exists even if the pace is not accelerating as fast as before.
The stochastic oscillator is less emphatic. At %K 78.4 and %D 89.8, it is not flashing a clean reversal, but it is also not delivering strong fresh upside confirmation. Read together, the oscillators describe a market that is still bullish in trend terms, but increasingly stretched in the short run.
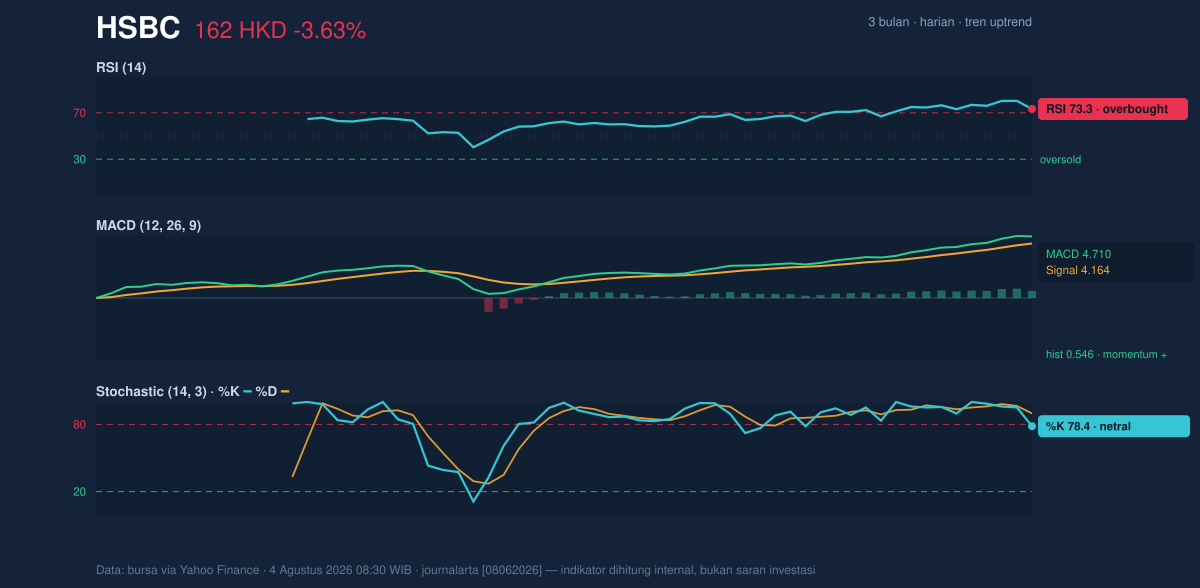
That combination is important: RSI is overbought, while MACD remains positive. When those two disagree, it often means trend followers still have the upper hand, but timing risk has increased.
Volatility & Volume
Volatility is moderate rather than explosive. HSBC’s ATR(14) of 3.02, equal to 1.9% of price, suggests the stock is moving enough to create meaningful daily swings, but not so much that the chart is in panic mode. The Bollinger Bands reinforce that reading: the band width is 13.1%, described as normal, which argues against a volatility squeeze or a breakout panic. Price is also at %B 63%, meaning it is trading above the midline but not hugging the upper band at 169.76. That is a useful signal: the stock still has room before it reaches the upper edge of its current statistical range, but it is not cheap within that structure.
Volume adds a stronger note of conviction. The latest turnover of 27,429,003 shares is about 1.9× the 20-hour average of 14,189,941, and OBV is rising. OBV, or on-balance volume, tracks whether volume is flowing into the stock on up days more than out of it on down days. A rising OBV alongside an above-average volume spike suggests participation is still broad enough to support the trend, even if the latest session was weaker.
High volume on a down day is not automatically bearish. It can also mean the market is actively testing buyers.
Key Levels & Scenarios
The chart’s immediate map is clear. The first line to watch is support at 159.31, which is also the SMA20 and the Bollinger midline. That makes it a high-value pivot: if price holds above it, the uptrend remains intact on a technical basis. Beneath that, the next visible support is 151.90, close to the SMA50 at 151.48, which would be the more serious test of trend durability. On the upside, 168.20 is the nearest resistance, with the 169.76 Bollinger upper band and the 3-month high of 169.70 forming a tight ceiling.
If HSBC reclaims 168.20 and sustains above it, the chart would suggest the pullback has been absorbed and the stock is probing the top of its range again. If it fails to hold 159.31, the market would be signaling that the recent rise has lost some traction and could rotate toward 151.90.
Technical Verdict: HOLD (wait & see)
HOLD (wait & see)
- RSI at 73.3 shows the stock is overbought, so near-term upside may be harder to extend without a pause.
- MACD remains positive and OBV is rising, which keeps the broader uptrend intact.
- Price above SMA20 and SMA50 supports the trend, but the latest drop into a resistance-heavy zone argues for patience.
Verdict invalidated if price falls below 151.90, because that would put the share back under the key support/SMA50 area and weaken the current trend structure.
- Ideal Entry Range: 159.31 to 151.90
- Exit Target: 168.20 to 169.76
- Stop Loss protection: below 151.90
For non-traders: HSBC is still in an uptrend, but the chart says the next move needs confirmation rather than assumption.
Volume: 27,429,003 shares versus a 14,189,941 average.
Summary Data HSBC
| Last price | 162.10 HKD |
| Change 1 day / 5 days / 1 month | -3.63% / 0.06% / 5.74% |
| Trend / MA-cross | uptrend / none |
| SMA20 / SMA50 | 159.31 / 151.48 |
| RSI (14) / Stochastic %K | 73.3 / 78.4 |
| Bollinger %B / ATR | 63% / 3.02 |
| Support / Resistance 20 days | 151.90 / 168.20 |
| Data as of | 4 Agustus 2026 08:30 WIB |



