Momentum Gains, Shell Stock Drops 3.67% Today
On Agustus 6, 2026: price 3,280.50 GBp, trend uptrend, RSI 59.3, support 3,038.50, resistance 3,405.50. technical analysis of shell stock.

Shell plc shares on the London Stock Exchange fell to 3,280.50 GBp by 14:00 WIB on 4 August 2026, even after a strong month that has left the stock 8.95% higher over 1 month, according to exchange data cited via Yahoo Finance. The pullback looks more like a pause inside an established advance than a full trend break, because the price remains above the SMA20 at 3,231.03 and above the SMA50 at 3,132.80, while the broader trend is still flagged as an uptrend. That matters because traders often watch those moving averages as a rough map of whether short-term momentum is still carrying the stock or whether the market is beginning to lose altitude.
Trend & Price Action
The share price is sitting in the upper part of its recent trading band, at roughly 66% of the 20-day range, with the 20-day support at 3,038.50 and 20-day resistance at 3,405.50. In plain terms, Shell is not near the lower end where buyers usually look defensive, but neither is it pressing the ceiling where momentum often starts to stall. The stock is also trading inside a broader three-month corridor between 2,559.50 and 3,758.50, which shows there is still room on both sides if the market decides to reprice the shares more aggressively.
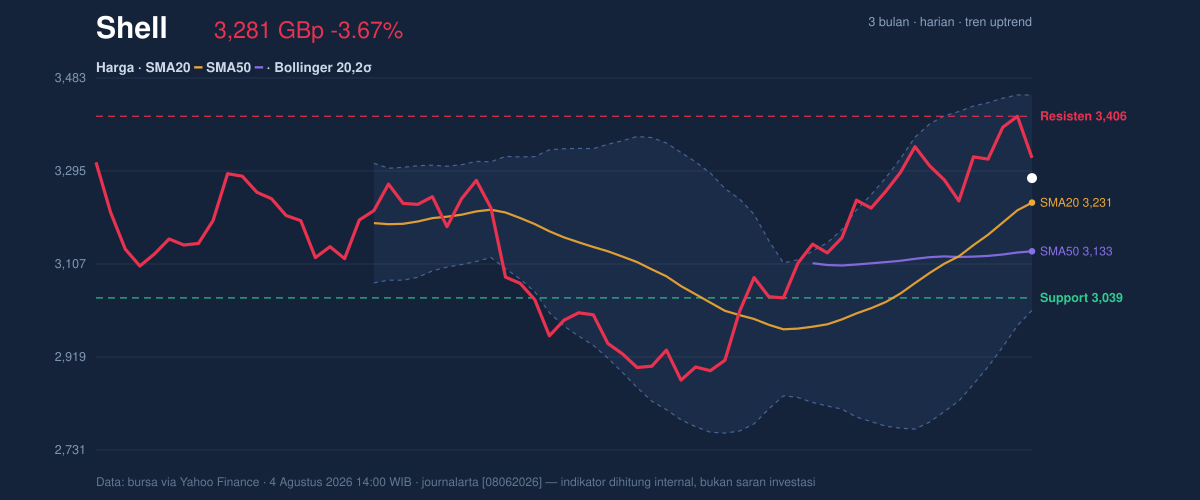
The chart shows a constructive structure: price above both the short- and medium-term averages, with the SMA20 rising 3.47% over 5 days. That slope is an important signal because it says the market has been willing to pay progressively higher prices over the recent week, even after the day’s -3.67% drop from the previous close of 3,405.50. The absence of a fresh MA-cross is also meaningful; it suggests the trend is being carried by existing alignment rather than by a new bullish trigger, so the move is healthy but not freshly ignited.
Oscillators & Momentum
Momentum indicators are broadly supportive, but not stretched enough to imply a one-way move. The RSI at 59.3 is neutral, which usually means Shell has room to extend without immediately running into overbought conditions. The Stochastic %K at 68.0 and %D at 87.8 are also neutral, though the gap between them hints that short-term enthusiasm has cooled a little from a hotter reading. That is the kind of setup that often appears when a stock is consolidating after a run rather than reversing outright.
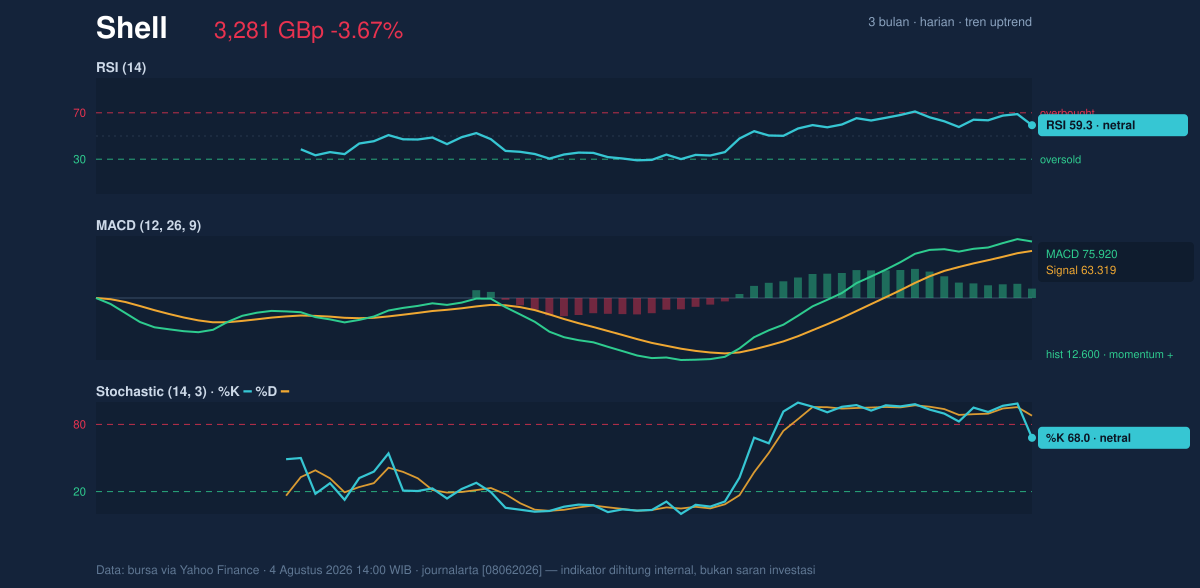
The more decisive signal comes from MACD, where MACD at 75.920 sits above the signal line at 63.319 and the histogram at 12.600 is positive. MACD measures whether price momentum is accelerating or slowing; here, it says the underlying trend still has positive thrust even if the latest session was weak. Put together, the oscillators do not show panic, but they do show a market that is trying to digest gains rather than chase them blindly.
Volatility & Volume
Volatility is present, but not excessive. The ATR at 78.39, or 2.4% of price, points to moderate daily movement, which is consistent with a large-cap energy name that can swing on oil, refining margins, or broader risk appetite without becoming disorderly. Bollinger Bands reinforce that picture: price is trading at %B 61%, with the band width at 13.5%, described as normal. In practice, that means Shell is neither compressed in a tight squeeze nor breaking out in an unusually volatile expansion.
The key Bollinger reference is the middle band at 3,231.03, which lines up with the SMA20 and acts as a fair-value anchor for the current trend. Price remaining above that line tells you the market is still willing to price Shell at a premium to its recent average. Volume adds a useful confirmation: the latest turnover of 8,493,595 is close to the 20-day average of 8,911,415, or roughly 1.0× normal, while OBV is rising. That combination suggests participation has not dried up, and the advance has been supported by accumulation rather than a thin, speculative push.
Key Levels & Scenarios
The immediate battlefield is clear. 3,405.50 is the first resistance to watch because it matches the prior close and the top of the 20-day range, so a clean move through it would signal that the recent dip has been absorbed. On the downside, 3,231.03 is the first major support cluster because it overlaps the SMA20 and Bollinger middle band, while 3,038.50 is the deeper support that would matter if the trend starts to weaken.
If Shell holds above 3,231.03 and reclaims 3,405.50, the chart would look more like a continuation pattern than a reversal. If it loses 3,231.03 and especially 3,038.50, the tone would shift from consolidation to distribution, because price would be slipping back through the levels that currently define the uptrend.
Technical Verdict: HOLD (wait & see)
HOLD (wait & see) is the cleanest read from the current setup.
- Trend is still positive: price is above SMA20 at 3,231.03 and SMA50 at 3,132.80, with the SMA20 slope up 3.47%/5 days.
- Momentum remains constructive: MACD is above signal and the histogram is positive, while RSI at 59.3 is not overheated.
- Volatility and volume are orderly: Bollinger width is normal, ATR is moderate, and OBV is rising, which supports the trend but does not yet confirm a fresh breakout.
- Verdict invalidated if price falls below 3,038.50, because that would break the 20-day support and weaken the current uptrend structure.
- Ideal entry range: 3,231.03 to 3,405.50
- Exit target: 3,405.50
- Stop loss protection: 3,038.50
In plain English, Shell still looks technically firm, but the chart is asking for confirmation before the next leg is trusted. “The market is still paying attention — but it wants proof.”
Summary Data Shell
| Last price | 3,280.50 GBp |
| Change 1 day / 5 days / 1 month | -3.67% / 1.42% / 8.95% |
| Trend / MA-cross | uptrend / none |
| SMA20 / SMA50 | 3,231.03 / 3,132.80 |
| RSI (14) / Stochastic %K | 59.3 / 68.0 |
| Bollinger %B / ATR | 61% / 78.39 |
| Support / Resistance 20 days | 3,038.50 / 3,405.50 |
| Data as of | 4 Agustus 2026 14:00 WIB |



