OCBC Stock Analysis: Drops 0.83%, Momentum Weakens
On Agustus 6, 2026: price 28.63 SGD, trend uptrend, RSI 61.5, support 26.79, resistance 29.78. technical analysis of ocbc stock. OCBC Stock Analysis — full…

OCBC Bank’s Singapore-listed shares slipped to SGD 28.63 as of 4 August 2026 08:00 WIB, according to Yahoo Finance data sourced from the exchange, extending a mild pullback after a 1-day decline of 0.83% and a 5-day drop of 1.04%. That weakness sits inside a broader constructive picture: the stock is still up 8.69% over one month, and the chart remains in an uptrend with the SMA20 at 28.55 rising at a 3.39% pace over five days. In plain terms, the trend is still pointing higher, but the latest price action shows buyers are no longer pushing with the same urgency.
Trend & Price Action
The key technical message is that OCBC is trading above its SMA20 and well above its SMA50 at 26.03, which keeps the medium-term structure intact. There is no fresh MA cross, so the chart is not flashing a new acceleration signal; instead, it suggests the stock is consolidating after a run rather than starting a new leg. The price is also sitting at roughly 62% of its 20-hour range, with the 20-hour support at 26.79 and 20-hour resistance at 29.78. That placement matters: it tells us the shares are closer to the upper half of the recent trading band, but not yet pressing the ceiling.
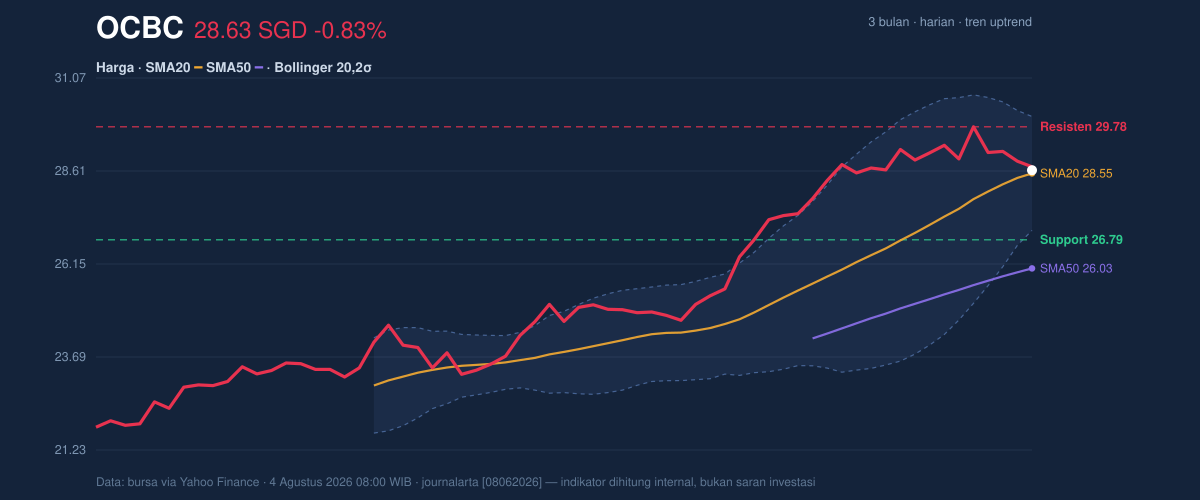
The stock’s position near the middle-to-upper part of the range, combined with a one-month gain, usually signals a market that still has a bullish base but is searching for fresh confirmation. The 3-month high of 29.78 is now the obvious reference point. If the stock can reclaim that zone decisively, it would indicate buyers are willing to absorb supply at the top of the recent range. If it fails there, the market is likely to keep treating that level as a lid rather than a launchpad.
Oscillators & Momentum
Momentum is less persuasive than the trend. The RSI at 61.5 is still neutral, which means the stock is not stretched enough to be considered overbought, but it is also not washed out enough to suggest a deep bargain zone. The Stochastic %K at 30.7 versus %D at 51.8 points to softer short-term momentum, because the faster line is below the slower line. That is often a sign that the recent push has cooled and that traders are waiting for a clearer turn.
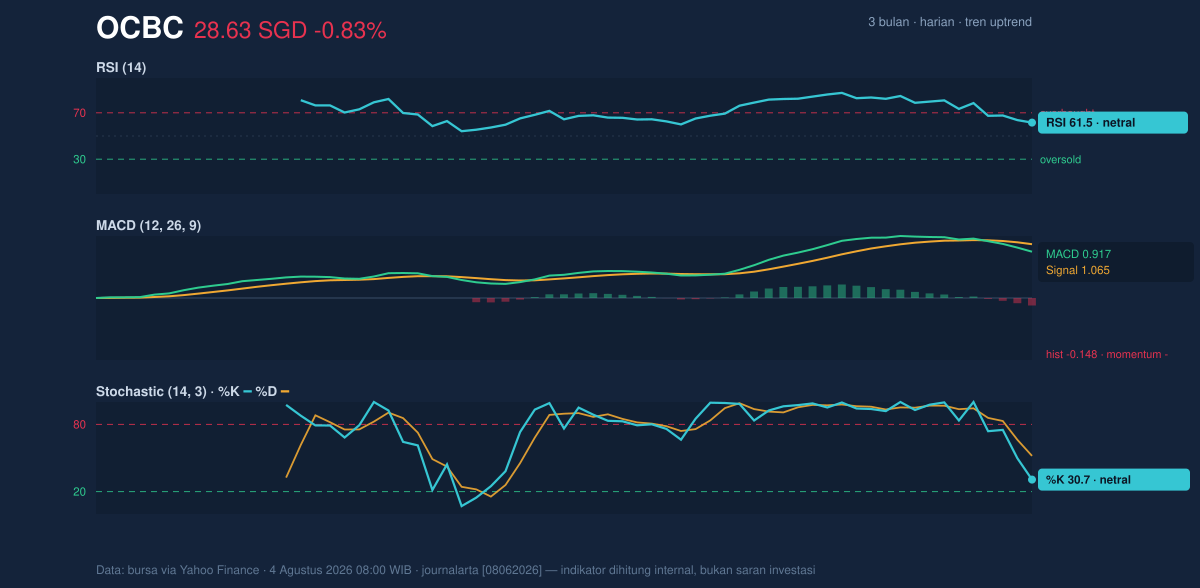
The most telling signal is the MACD at 0.917 versus its signal line at 1.065, leaving a -0.148 histogram. MACD is a trend-following momentum tool, and a negative histogram means the short-term pace has slipped below the longer-term baseline. In practical terms, the stock is still in an uptrend, but momentum is no longer fully confirming it. That kind of divergence does not automatically mean a reversal; more often, it means the market needs either a pause or a fresh burst of volume to restore conviction.
Volatility & Volume
Volatility is moderate rather than explosive. The ATR(14) at 0.56, equal to 1.9% of price, suggests the stock can move, but not in a disorderly way. The Bollinger Bands add another layer: the upper band at 30.05, middle band at 28.55, and lower band at 27.04 frame the current price almost exactly around the midline, with %B at 53% and a 10.6% band width. That combination is important because it shows the shares are not in a squeeze, where price compresses before a breakout, nor in a volatility spike. They are in a normal band regime, which usually means the next move will need a catalyst from either price acceptance above resistance or a failure back toward support.
Volume is not helping the bull case much right now. The latest turnover of 5,640,700 is below the 20-hour average of 6,795,915, or about 0.8x normal. That is a participation warning: when price drifts lower on lighter-than-average volume, it often means sellers are not pressing aggressively, but buyers are also not stepping in with force. The fact that OBV is falling reinforces that reading, because on-balance volume tracks whether money flow is accumulating or leaking out. A falling OBV while price still sits above key averages suggests the advance is losing sponsorship beneath the surface.
Key Levels & Scenarios
The immediate map is clear. Support at 26.79 is the first line to watch, while resistance at 29.78 is the level that would need to be cleared for the chart to regain momentum. The SMA20 at 28.55 is acting as a near-term pivot, and the upper Bollinger band at 30.05 marks the next technical ceiling beyond resistance.
If price holds above the SMA20 and starts to close above 29.78, the chart would shift from consolidation to renewed trend extension. If it slips back below the middle Bollinger band at 28.55 and loses the 27.04 lower band, the market would be signaling that the recent uptrend is under more serious pressure. The current setup therefore looks less like a breakout in progress and more like a test of whether the prior advance can be defended.
Technical Verdict: HOLD (wait & see)
HOLD (wait & see)
- Trend remains positive: price is above the SMA20 at 28.55 and well above the SMA50 at 26.03, so the larger structure is still constructive.
- Momentum is mixed: MACD is negative on the histogram and Stochastic is soft, which means the stock is not yet showing strong fresh upside confirmation.
- Participation is weak: volume is below average at 0.8x normal and OBV is down, so the latest move lacks strong confirmation.
Verdict invalidated if price breaks below 26.79.
- Ideal Entry Range: 28.55 to 27.04
- Exit Target (Target Price): 29.78 to 30.05
- Stop Loss protection: below 26.79
In plain English: OCBC’s chart still leans upward, but the latest momentum and volume signals say the market is waiting for proof before the next move.
Summary Data OCBC
| Last price | 28.63 SGD |
| Change 1 day / 5 days / 1 month | -0.83% / -1.04% / 8.69% |
| Trend / MA-cross | uptrend / none |
| SMA20 / SMA50 | 28.55 / 26.03 |
| RSI (14) / Stochastic %K | 61.5 / 30.7 |
| Bollinger %B / ATR | 53% / 0.56 |
| Support / Resistance 20 days | 26.79 / 29.78 |
| Data as of | 4 Agustus 2026 08:00 WIB |



