Tencent Stock Gains 0.37% Today, Testing Key Resistance
On Agustus 6, 2026: price 492.20 HKD, trend uptrend, RSI 60.3, support 434.60, resistance 490.40. technical analysis of tencent stock. Tencent Stock Gains —…

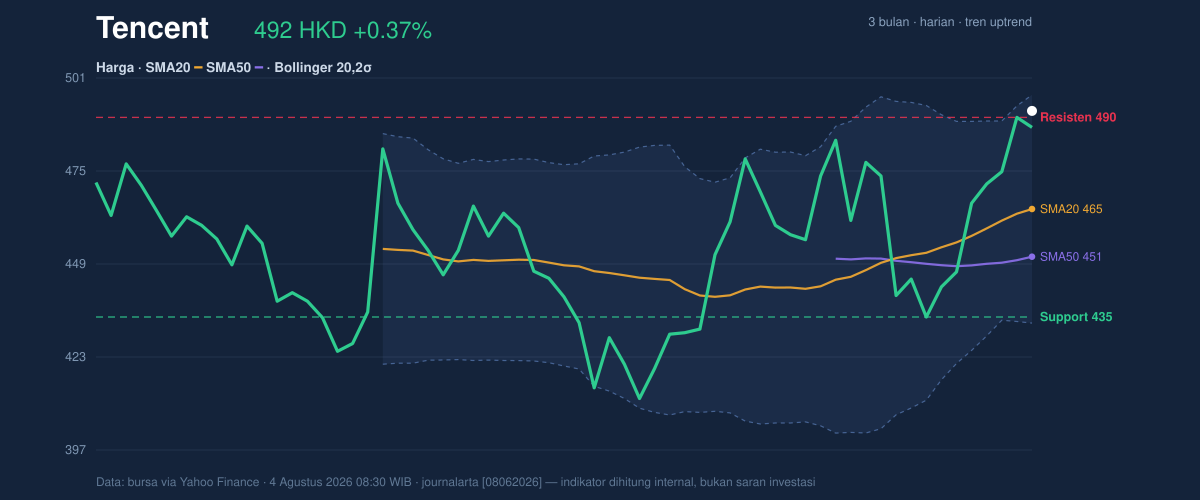
Tencent Holdings traded on the Hong Kong exchange at HKD 492.20 on 4 August 2026, edging above the previous close of 490.40 as the stock pressed into the top of its recent range. The move matters less for the size of the gain than for where it happened: Tencent is now sitting just under its 3-month high of 494.80, while its 20-day and 50-day moving averages remain firmly below price, a sign that the broader trend is still constructive even after a sharp short-term run. The chart shows a stock that has not merely recovered — it has climbed to a point where momentum is strong enough to keep the trend alive, but stretched enough to demand respect.
Trend & Price Action
Tencent’s price structure remains aligned with an uptrend. The stock is trading above SMA20 at 464.79 and SMA50 at 451.44, which tells investors the recent rally is still being supported by intermediate- and medium-term trend followers. The SMA20 slope of 2.05% over 5 days suggests the shorter trend is rising at a healthy pace, not just drifting sideways. That is important because rising moving averages often indicate demand is still absorbing supply rather than simply reacting to a one-off catalyst.
The absence of a new MA-cross means there is no fresh moving-average trigger to point to; instead, the market is being guided by price staying above the averages that already turned supportive earlier. With the stock at 103% of its 20-hour range and only a touch below the 20-hour resistance at 490.40, the chart shows a market testing the ceiling rather than comfortably cruising beneath it.
That is a strong place to be — but not a relaxed one.
Oscillators & Momentum
The momentum picture is mixed in a way that often appears near local highs. RSI at 60.3 is neutral, which means Tencent is not yet in a classic overbought zone on that measure. But the Stochastic %K at 88.5 and %D at 83.4 are in overbought territory, signaling the stock has risen fast enough that short-term buyers may already be crowded in. In plain English, the stock can still trend higher from here, but the pace of gains is vulnerable to pauses or brief pullbacks as traders take profits.
That tension is exactly what the chart is showing: trend strength remains intact, while short-horizon momentum is stretched. The MACD at 7.186, above its signal line at 3.949, with a positive histogram of 3.237, confirms that upward momentum is still dominant. MACD is not warning of a reversal; it is saying the underlying push is still positive even if the stock is no longer early in the move.
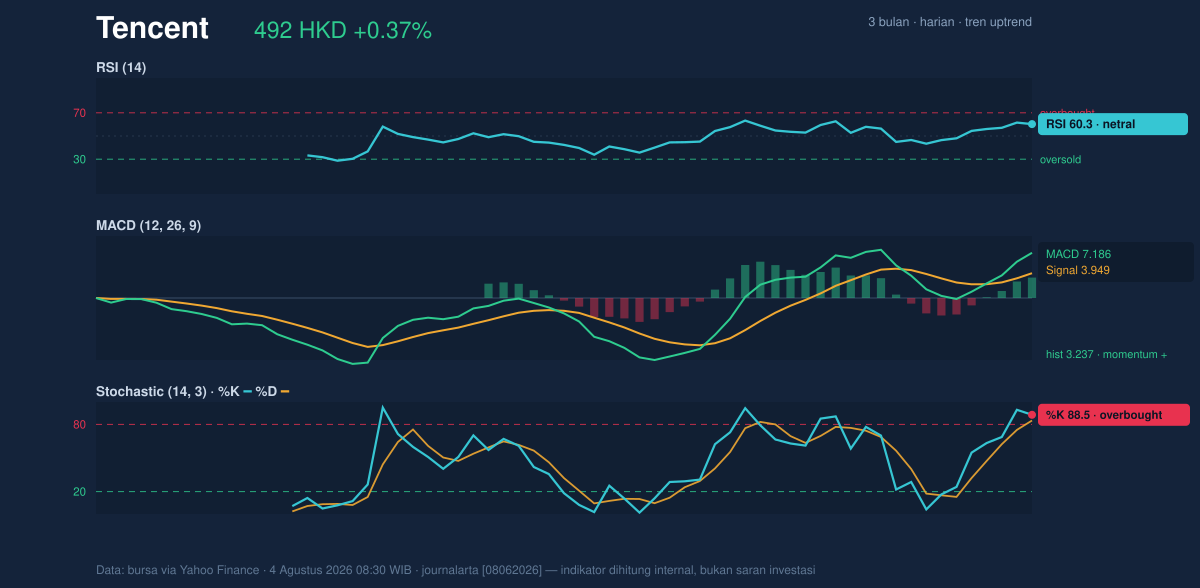
The message is simple: trend support is healthy, but the faster signals are flashing caution.
Volatility & Volume
Volatility is elevated enough to matter. Tencent’s ATR of 17.44, or 3.5% of price, indicates a stock capable of large daily swings. That matters because when a stock is near the upper edge of its range and volatility is high, price can move quickly in either direction once it meets resistance. The Bollinger Bands help frame that risk. Price is near the upper band at 496.68, with %B at 93%, which means the stock is trading very close to the top of its normal volatility envelope. The 13.7% band width is described as normal, so this is not a squeeze building up to an explosive breakout; rather, it is a mature move pressing against the upper boundary.
Volume adds an important nuance. The latest turnover of 24,860,019 shares is only 0.8× normal versus the 20-hour average of 33,072,048, suggesting the stock is climbing without full participation. That does not negate the uptrend, but it does tell you the latest push is not being confirmed by unusually heavy trading. Still, OBV is rising, which implies the broader flow of money remains constructive even if the latest session was not especially busy.
In other words: demand is present, but not roaring.
Key Levels & Scenarios
The nearest reference points are clear. On the downside, support at 434.60 marks the lower 20-hour boundary and a logical area where buyers previously reappeared. On the upside, resistance at 490.40 has already been challenged, and the stock is now hovering just above it with the upper Bollinger band at 496.68 and the 3-month high at 494.80 acting as the next visible tests. Because price is already near the top of the range, the market is telling us that continuation will likely need either a clean push through the recent ceiling or a reset that allows momentum to cool.
If Tencent can hold above 490.40 and then clear 494.80, the chart would be signaling that buyers are willing to pay into new highs rather than simply chase an already extended move. If it fails to hold the current zone, the first meaningful check is whether price retreats toward the rising averages near 464.79 and 451.44. A deeper slide toward 434.60 would suggest the recent advance has lost traction.
Technical Verdict: HOLD (wait & see)
HOLD (wait & see)
- MACD remains positive, so the broader momentum trend is still constructive.
- Price is above SMA20 and SMA50, confirming the uptrend has not broken.
- Stochastic is overbought and price is near the upper Bollinger band, which raises the odds of a pause or pullback after the recent run.
- Verdict invalidated if price falls below 434.60, which would weaken the current support structure.
- Ideal Entry Range: 464.79 to 490.40
- Exit Target: 494.80 to 496.68
- Stop Loss protection: below 434.60
For non-traders, this means Tencent still looks technically strong, but it is close enough to resistance that the chart is asking for patience rather than urgency.
“The market is still willing to pay up for Tencent, but not yet with the conviction that usually comes before a clean breakout.”
Summary Data Tencent
| Last price | 492.20 HKD |
| Change 1 day / 5 days / 1 month | 0.37% / 10.06% / 6.72% |
| Trend / MA-cross | uptrend / none |
| SMA20 / SMA50 | 464.79 / 451.44 |
| RSI (14) / Stochastic %K | 60.3 / 88.5 |
| Bollinger %B / ATR | 93% / 17.44 |
| Support / Resistance 20 days | 434.60 / 490.40 |
| Data as of | 4 Agustus 2026 08:30 WIB |



