Testing Support Level, Singtel Stock Drops 1.14% Today
On Agustus 6, 2026: price 4.35 SGD, trend sideways, RSI 48.9, support 4.37, resistance 4.61. technical analysis of singtel stock. Testing Support Level — full…

Singapore Telecommunications Ltd. (Singtel) fell to SGD 4.35 on SGX, down from the previous close of 4.40, as the stock slipped back below its short-term average and stayed pinned near the lower edge of its recent trading band. The move looks modest on the surface, but the chart says something more specific: sellers have enough control to keep price under pressure, yet not enough conviction to force a clean breakdown, leaving the shares in a fragile sideways range rather than a decisive downtrend.
Trend & Price Action
The broader setup remains sideways, with the SMA20 slope still positive at 0.29% over five days, which means the medium-term trend is not deteriorating sharply even though price is below SMA20 at 4.44. That gap matters because the 20-day average often acts like a short-term sentiment line: trading under it signals that recent buyers are no longer in full control, while the fact that SMA50 sits at 4.39 and is close to price shows the stock is hovering around a decision zone rather than in a strong directional move. There is no new MA-cross, so the chart has not delivered a fresh trend signal; instead, it is still waiting for one.
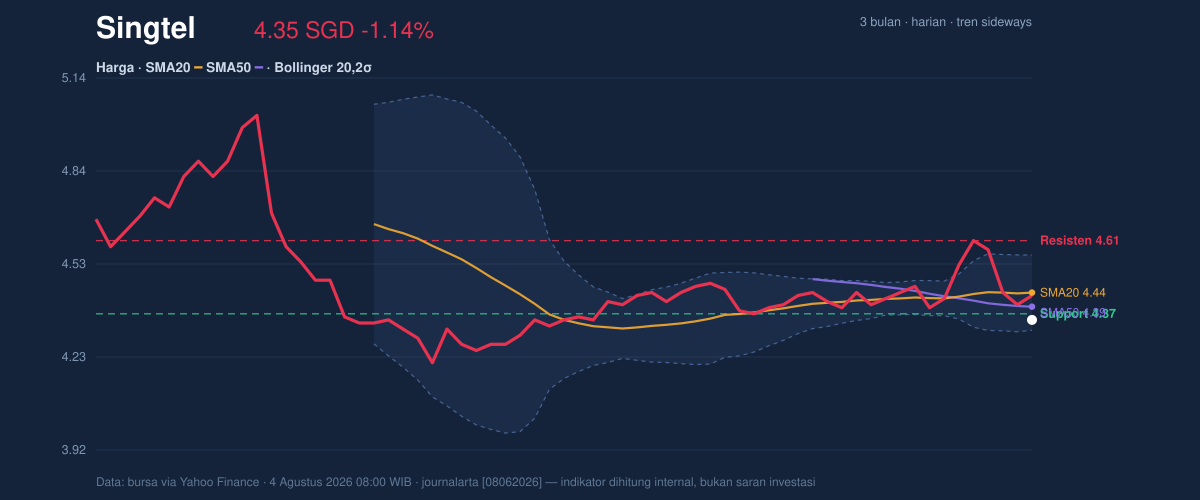
The position inside the Bollinger Bands reinforces that cautious reading. With the lower band at 4.32, middle band at 4.44, and upper band at 4.56, Singtel is trading near the lower half of the range, and the %B at 14% shows price is sitting close to the bottom of that envelope. In plain language, that usually means the market is discounting near-term upside, but not necessarily pricing in a full breakdown. The 5.6% band width is also narrowing, which is the textbook sign of a squeeze: volatility has compressed, and compressed volatility often precedes a larger move once price escapes the band.
Oscillators & Momentum
The momentum picture is mixed rather than decisive. RSI(14) at 48.9 is neutral, which tells readers that the stock is neither overbought nor oversold and that momentum is balanced but uninspiring. The Stochastic %K at 22.9 and %D at 21.0 sits near the lower end of its range, which usually indicates the stock is close to an oversold zone, but not yet in the kind of extreme that often precedes a sharp rebound. That is an important distinction: weak stochastic readings can simply reflect persistent softness, not an automatic reversal.
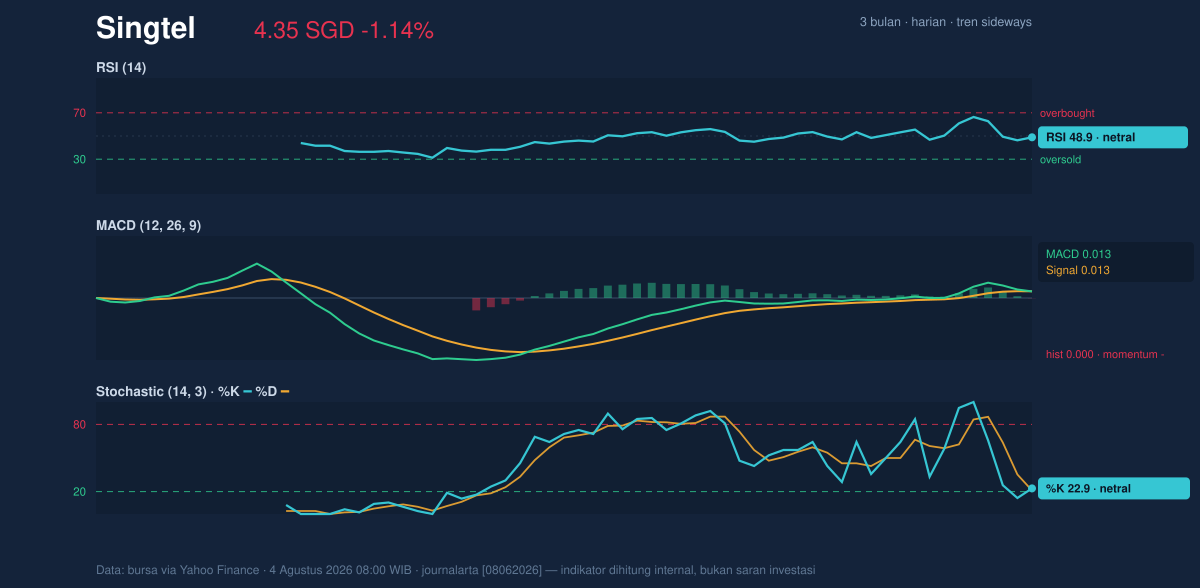
The more cautionary signal comes from MACD. MACD at 0.013, matching the signal line at 0.013, leaves a histogram of 0.000, which means momentum is effectively flat and has lost directional force. In other words, the stock is not building bullish acceleration, and it is not showing a strong bearish impulse either. That kind of near-zero MACD reading often appears when a stock is pausing before a breakout or breakdown, especially when paired with a Bollinger squeeze.
Volatility & Volume
Volatility is moderate, not elevated. The ATR(14) of 0.09, equal to 2.2% of price, suggests daily swings are present but not extreme. That matters because a compressed range can make even small moves meaningful; a 0.09 change is enough to test nearby support or resistance quickly. Volume adds a subtle but important layer. Last volume was 27,442,900, below the 20-day average of 31,999,655, or 0.9× normal, which means the latest decline was not powered by unusually heavy participation. That weakens the case for a strong bearish breakdown. At the same time, OBV is rising, and that is a constructive divergence: on-balance volume tracks whether money flow has been accumulating over time, so a rising OBV while price drifts lower can hint that longer-horizon buyers are still active beneath the surface.
Key Levels & Scenarios
The immediate map is clear. Support at 4.37 is the first level to watch, while resistance at 4.61 caps the current range. The stock is currently sitting about 8% from the top of that range, which tells readers it is closer to the floor than the ceiling. That positioning matters because a market near support can either stabilize and rebound, or slip into a deeper reset if buyers fail to defend the area. The broader three-month range, from 5.05 down to 4.15, shows the stock is still trading well below its recent peak but not far above the lower end of that span.
If 4.37 gives way decisively, the lower Bollinger band at 4.32 becomes the next technical reference, and a break there would suggest the squeeze is resolving downward. If price reclaims 4.44 and then pushes through 4.61, the chart would shift toward a recovery attempt, because that would place the stock back above the middle band and into the upper half of the recent range. For now, the signal is one of compression and hesitation rather than confirmation.
Technical Verdict: HOLD (wait & see)
- Reason 1: Price is below SMA20 at 4.44, which shows short-term weakness, but the broader setup is still sideways and SMA50 at 4.39 is close enough to suggest no clear trend break yet.
- Reason 2: RSI at 48.9 and Stochastic 22.9 / 21.0 are neutral-to-soft, while MACD is flat at 0.013 with a zero histogram, so momentum is not confirming a meaningful move in either direction.
- Reason 3: Bollinger Bands are squeezing and OBV is rising, a combination that signals stored energy and underlying accumulation, but not yet a confirmed breakout.
- Verdict invalidated if price falls below 4.32, the lower Bollinger band and next technical floor.
- Ideal entry range: 4.32 to 4.39
- Exit target: 4.44 to 4.61
- Stop loss protection: below 4.32
In plain English, the chart says Singtel is stuck in a tight range and needs a clear break before the next meaningful move becomes obvious.
The latest volume was 27,442,900, below the 20-day average of 31,999,655.
Summary Data Singtel
| Last price | 4.35 SGD |
| Change 1 day / 5 days / 1 month | -1.14% / -3.97% / -0.68% |
| Trend / MA-cross | sideways / none |
| SMA20 / SMA50 | 4.44 / 4.39 |
| RSI (14) / Stochastic %K | 48.9 / 22.9 |
| Bollinger %B / ATR | 14% / 0.09 |
| Support / Resistance 20 days | 4.37 / 4.61 |
| Data as of | 4 Agustus 2026 08:00 WIB |



