UOB Stock Gains 0.05% Today, Testing Support Level
On Agustus 6, 2026: price 43.06 SGD, trend sideways, RSI 57.6, support 42.47, resistance 44.95. technical analysis of uob stock. UOB Stock Gains — full details…

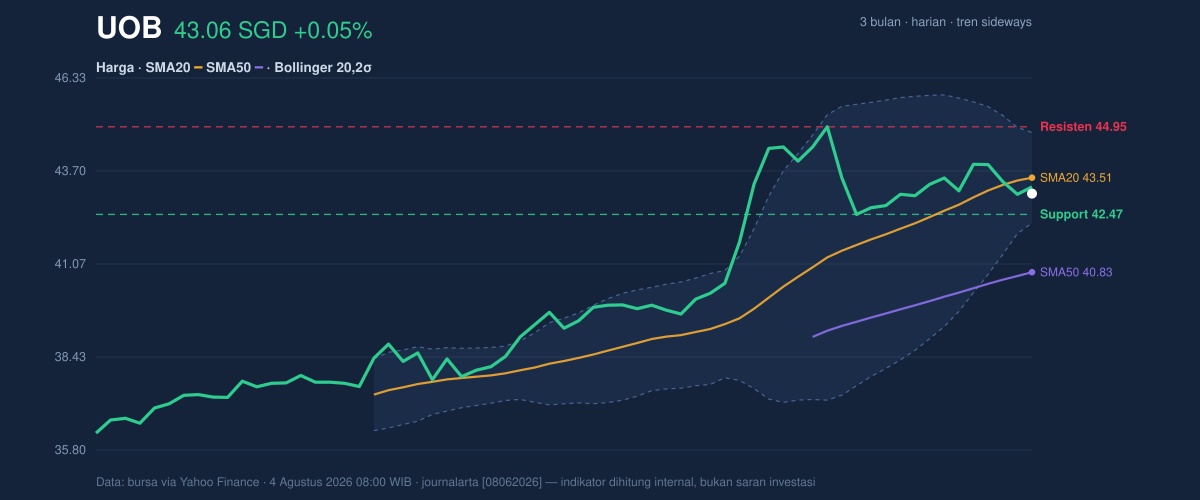
United Overseas Bank (UOB) edged to SGD 43.06 on the SGX, barely above the previous close of 43.04, while the chart still shows a stock that is moving sideways rather than breaking into a fresh trend. The price is sitting below the SMA20 at 43.51 but above the SMA50 at 40.83, which tells investors the medium-term structure is still intact even as short-term momentum has cooled. That mix matters: in plain English, the shares are not in a clear downtrend, yet they are also not strong enough to reclaim the near-term average that often acts like a line of control for traders. The latest reading places UOB in the lower part of its recent range, with the next move likely to be decided by whether buyers can defend nearby support or whether sellers press the stock back toward the lower Bollinger band.
Trend & Price Action
As shown in the chart, UOB remains in a sideways trend, and the slope of the SMA20 at 1.79% over 5 days suggests the short-term average is still rising, even if the share price has slipped underneath it. That is an important nuance: a rising moving average means the broader recent tone has not turned decisively bearish, but the market is currently trading with enough hesitation to keep the price below the short-term trend line. There is no new MA-cross, so the chart is not flashing a fresh trend reversal signal. Instead, it is showing a consolidation phase, where price and averages are compressing and waiting for a catalyst.
The stock is also trading well off its 3-month high of 45.15, but comfortably above the 3-month low of 36.01. That positioning suggests the market has already recovered from the deeper selloff, yet it has not been able to extend that rebound into a clean breakout. The latest close is only slightly above the prior close, which reinforces the idea that UOB is drifting rather than surging.
Oscillators & Momentum
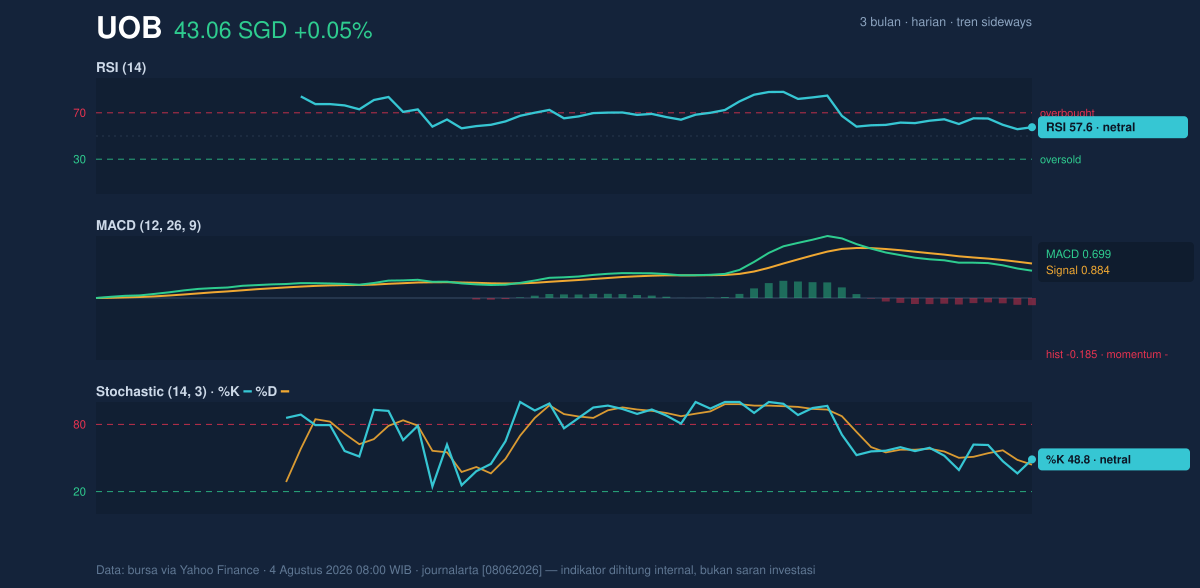
The momentum tools are mixed, and that is the key signal to watch. RSI(14) at 57.6 is neutral, which means the stock is neither overbought nor oversold. In practical terms, that leaves room for movement in either direction; it does not force a reversal by itself. Stochastic %K at 48.8 and %D at 44.1 are also neutral, but they sit close enough together to imply balance rather than conviction. There is no strong upside thrust, yet there is no deeply stretched downside condition either.
The more cautionary read comes from MACD at 0.699 versus signal at 0.884, with a histogram of -0.185. That negative histogram means short-term momentum is weaker than the MACD line would otherwise suggest, a sign that the recent lift in price is losing force. For general readers, MACD is a trend-following gauge: when the histogram turns negative, it often means the market is still above water, but the pace of ascent is fading. In other words, UOB is not collapsing, but the stock is not yet proving it can accelerate higher from here.
Volatility & Volume
The Bollinger Bands add another layer to the story. UOB is trading at %B 32%, which places the price closer to the lower half of the band structure than the upper edge. The bands themselves are relatively tight, with width at 5.9%, and that narrowing points to a squeeze. A squeeze does not predict direction, but it does signal that the market is coiling and may be preparing for a larger move once one side wins control. With the price below the middle band at 43.51, the immediate bias remains cautious.
Volatility is present but not extreme. ATR(14) at 0.83, or 1.9% of price, indicates a moderate daily swing range. That matters because it frames how quickly the stock can move once it leaves the current congestion zone. A moderate ATR combined with a tight Bollinger setup often means the next directional move can be sharper than the recent day-to-day drift.
Volume, however, is not yet confirming a breakout attempt. Last traded volume was 1,590,100, far below the 20-hour average of 3,699,083, or about 0.4x normal activity. That is a sign of caution: when participation is thin, price moves are less trustworthy and more vulnerable to reversal. OBV is falling, which means the cumulative volume trend is not backing the recent price stability. In simple terms, the stock may be holding its ground, but the crowd is not showing up in force to support a stronger advance.
Key Levels & Scenarios
The nearest technical floor is 42.47, the 20-hour support. That level is important because it sits just below the current price and near the lower Bollinger band at 42.23, creating a small support cluster. If UOB holds above that zone, the market can keep treating the current move as a pause rather than a breakdown. If it fails, the chart opens the door to a deeper test of the lower band and the lower end of the recent range.
On the upside, 44.95 is the key resistance from the 20-hour range, with the Bollinger upper band at 44.79 acting as an earlier technical ceiling. That means the stock would need to reclaim the middle band at 43.51 first, then push through the upper part of the range before any stronger improvement in tone can be argued. The fact that the price is currently only at 24% of the recent range leaves room for recovery, but not yet proof of it.
Technical Verdict: HOLD (wait & see)
HOLD (wait & see) is the clearest technical read because the chart is balanced but not confirmed. RSI and Stochastic are neutral, which limits urgency; MACD histogram is negative, which warns that momentum is soft; and volume/OBV are not supporting a decisive breakout. At the same time, the stock remains above the SMA50 at 40.83, so the broader structure has not broken down.
- Ideal entry range: 42.47 to 43.51, where support and the middle Bollinger band overlap
- Exit target: 44.79 to 44.95, aligned with the upper Bollinger band and 20-hour resistance
- Stop loss protection: below 42.23, the lower Bollinger band, or a sustained break under 42.47 support
This means UOB is in a pause phase: the stock has not lost its base, but it has not yet earned a stronger upside signal.
The next technical checkpoint is whether the shares can reclaim 43.51 and then test 44.95, with the latest volume trend and OBV still the first clues on whether that move has real backing.
Summary Data UOB
| Last price | 43.06 SGD |
| Change 1 day / 5 days / 1 month | 0.05% / -0.19% / 3.29% |
| Trend / MA-cross | sideways / none |
| SMA20 / SMA50 | 43.51 / 40.83 |
| RSI (14) / Stochastic %K | 57.6 / 48.8 |
| Bollinger %B / ATR | 32% / 0.83 |
| Support / Resistance 20 days | 42.47 / 44.95 |
| Data as of | 4 Agustus 2026 08:00 WIB |


