WMT Momentum Gains: Stock Gains 0.71% (Agustus 6, 2026)
On Agustus 6, 2026: price 112.34 USD, trend sideways, RSI 48.0, support 108.40, resistance 114.95. technical analysis of wmt stock. WMT Momentum Gains — full…

Walmart is holding a narrow technical footing above its short-term average, but the stock is still capped below a heavier longer-term trend line, leaving traders focused on whether a tightening range turns into a breakout or fades back toward support.
Walmart’s shares on the NYSE last changed hands at 112.34 USD, up 0.71% on the day, according to the exchange data cited in the Yahoo Finance feed. The move matters less for its size than for where it occurred: the stock finished above SMA20 at 112.10, but still below SMA50 at 114.88. That puts WMT in a classic middle ground. It is not weak enough to signal outright breakdown pressure, yet it has not reclaimed the longer average that would show firmer trend control. In plain terms, the market is respecting the short-term floor while still hesitating to commit to a stronger advance.
Trend & Price Action
The broader pattern remains sideways, and the SMA20 slope of 0.04% over 5 days reinforces that reading. A flat slope usually means the market is waiting for a catalyst rather than pricing in a decisive directional move. The absence of a new MA-cross also matters: there is no fresh signal that short-term momentum has overtaken the longer trend in a durable way. Instead, price is hovering near the middle of its recent band, with the stock sitting at about 60% of the 20-hour range. That positioning suggests buyers have enough presence to keep the share price off the lower end, but not enough urgency to force a clean test of resistance.
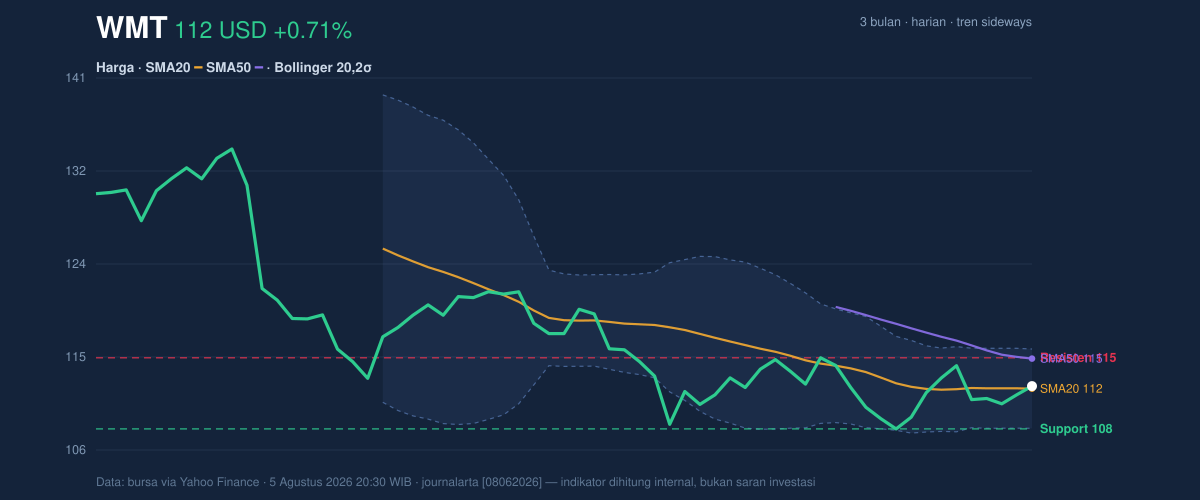
The Bollinger setup adds an important layer. The bands are relatively tight, with a 6.5% width, and the data describes that as a squeeze. In technical terms, a squeeze often means volatility has compressed and the next move can be sharper than the recent day-to-day drift. The upper band is at 115.76 and the lower band at 108.45, so WMT is trading between a near-term ceiling and floor that are not far from the current price. That compressed structure is why the chart matters: as shown in the chart, the stock is not trending strongly, but it is building pressure inside a defined corridor.
Oscillators & Momentum
Momentum is neutral, but not empty. The RSI at 48.0 sits just below the midpoint, which usually means neither buyers nor sellers have clear dominance. This is not an oversold condition that would imply panic, nor an overbought one that would suggest exhaustion. The Stochastic %K at 49.1 and %D at 42.0 also point to balance, though %K above %D hints at a mild short-term improvement. The more interesting signal is the MACD: MACD -1.104 remains below zero, which keeps the broader momentum picture cautious, but it is still above the signal line at -1.449 and the histogram at 0.345 is positive. That combination means downside momentum is easing, even if the trend has not fully flipped into a strong bullish phase.
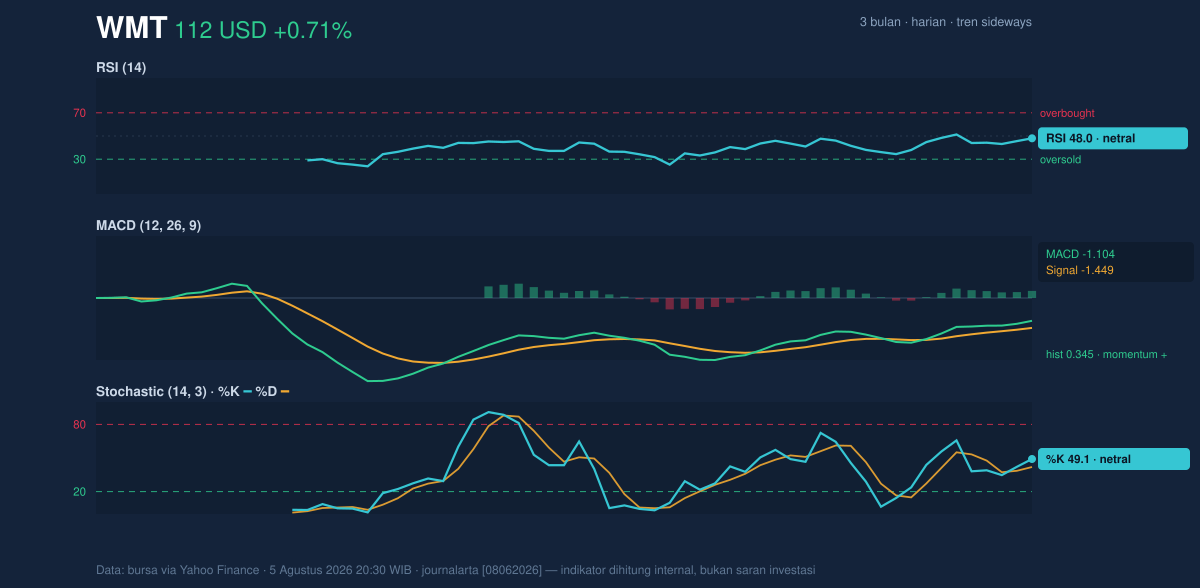
Read together, the oscillators are saying something subtle: WMT is not in a breakout state yet, but the internal momentum has improved enough to prevent a bearish reading from dominating. That is a constructive setup, especially when paired with volume.
Volatility & Volume
The ATR(14) of 2.73, equal to about 2.4% of price, points to moderate volatility. That matters because it suggests the stock can move, but not in a disorderly way. Combined with the Bollinger squeeze, it implies the next directional move may be more meaningful than the recent drift, even if the day-to-day swings remain contained for now.
Volume supports that idea. The latest print of 21.41 million shares was almost exactly in line with the 20-hour average of 21.40 million, or 1.0x normal. On its own, that is not a breakout volume surge. But the OBV is rising, which is important because on-balance volume tracks whether shares are being accumulated over time rather than just traded actively for a single session. A rising OBV alongside a flat-to-improving price structure often suggests quiet participation beneath the surface.
Key Levels & Scenarios
The immediate technical map is clear. Support at 108.40 sits just above the lower Bollinger band at 108.45, so that zone is the first place where buyers have recently shown up. On the upside, resistance at 114.95 lines up closely with the SMA50 at 114.88, making that area the key barrier to a more convincing trend repair. The upper Bollinger band at 115.76 provides a slightly higher reference point if price can push through the moving-average cap.
The 3-month range gives additional context: 135.16 was the high and 106.79 the low. WMT is closer to the lower half of that band than the top, but it is no longer pressing the floor. That placement supports a range-trading interpretation rather than a trend-collapse story.
Technical Verdict: HOLD (wait & see)
HOLD (wait & see)
- The RSI at 48.0 and Stochastic at 49.1 / 42.0 are neutral, so momentum is not strong enough to confirm a fresh directional move.
- The MACD histogram at 0.345 is positive and the MACD is above its signal line, which improves the tone, but the line remains below zero, so the broader trend is not fully repaired.
- The Bollinger squeeze and price sitting just above SMA20 at 112.10 suggest compression, not confirmation; the stock needs a cleaner break of nearby resistance or a firmer hold of support.
- Invalidation condition: the verdict is invalidated if price falls below 108.40.
- Ideal Entry Range: 108.45 to 112.10
- Exit Target: 114.95 to 115.76
- Stop Loss protection: below 108.40
For non-traders, this means the stock looks steady, but it has not yet proved that the next move will be a stronger one. The next scheduled test is the market’s ability to push WMT through 114.95 after the latest close at 112.34.
Summary Data WMT
| Last price | 112.34 USD |
| Change 1 day / 5 days / 1 month | 0.71% / -1.65% / -0.67% |
| Trend / MA-cross | sideways / none |
| SMA20 / SMA50 | 112.10 / 114.88 |
| RSI (14) / Stochastic %K | 48.0 / 49.1 |
| Bollinger %B / ATR | 53% / 2.73 |
| Support / Resistance 20 days | 108.40 / 114.95 |
| Data as of | 5 Agustus 2026 20:30 WIB |



