BP Stock Analysis: Drops 1.01%, Golden Cross Formed
On Agustus 7, 2026: price 519.70 GBp, trend sideways, RSI 46.9, support 481.80, resistance 555.90. technical analysis of bp stock. BP Stock Analysis — full…

BP plc is caught between a still-intact medium-term recovery signal and a softer near-term tape, with the shares drifting below short-term trend support even as longer moving averages keep the broader structure from turning decisively bearish.
BP’s London-listed shares were last at 519.70 GBp, down 1.01% on the day and 4.38% over five days, according to the LSE data feed via Yahoo Finance at 5 August 2026 14:00 WIB. That leaves the stock below its SMA20 at 525.33 but still above its SMA50 at 513.34. In plain terms, the price is sitting under the shorter trend line that traders often watch for immediate direction, while remaining above the longer one that helps define the broader trend. The result is a market that has not broken down, but is no longer moving with conviction.
Trend & Price Action
The chart shows a sideways pattern rather than a clean breakout or breakdown, and that matters because sideways markets often punish both late buyers and early sellers with false moves. BP is trading in the upper half of its recent range, at about 51% of the way between the 20-hour support at 481.80 and 20-hour resistance at 555.90. That positioning suggests the market has not lost the range, but it also has not reclaimed the upper boundary that would signal stronger demand.
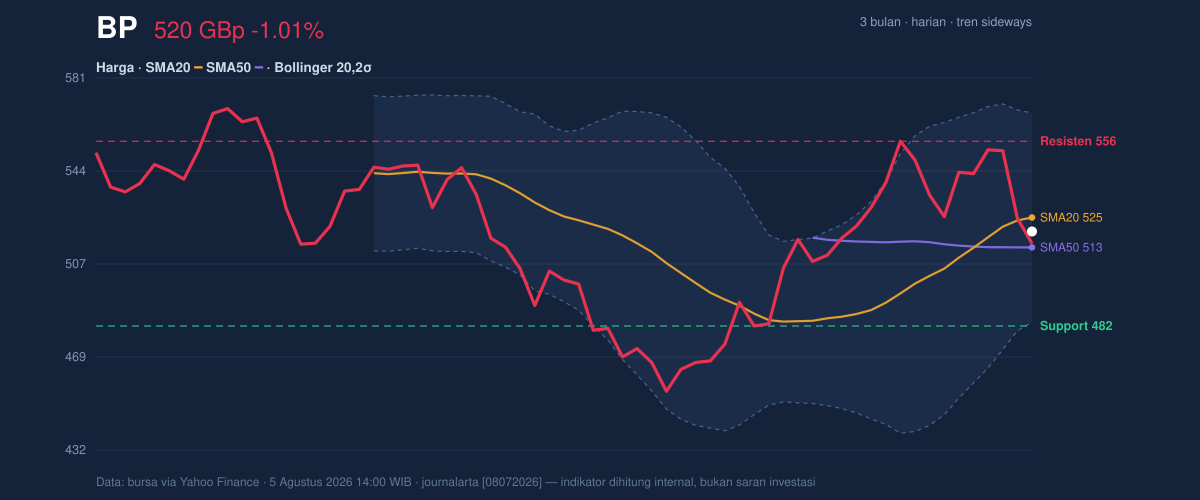
The moving-average setup is mixed. A golden cross is in place, meaning the SMA20 has crossed above the SMA50, which usually points to improving medium-term momentum. But the price is now sitting below the SMA20, and that is the more immediate warning. When price slips under the faster average after a bullish cross, it often means the trend needs fresh buying to keep going; otherwise, the cross becomes more of a background support signal than an active driver.
The Bollinger Band structure reinforces that caution. BP is trading near the middle of the band system, with %B at 43% and the bands themselves in a normal 16.0% width. That combination usually means the market is not in an extreme volatility phase and is not stretched enough to justify a momentum chase. The middle band sits at 525.33, which also lines up with the SMA20, so reclaiming that level would be an important sign that the recent pullback is being absorbed.
Oscillators & Momentum
The momentum picture is softer than the moving averages suggest. RSI at 46.9 is neutral, which means BP is neither overbought nor oversold on this measure. That is important because it tells readers the decline is not yet a panic move; it is more a loss of upward pace.
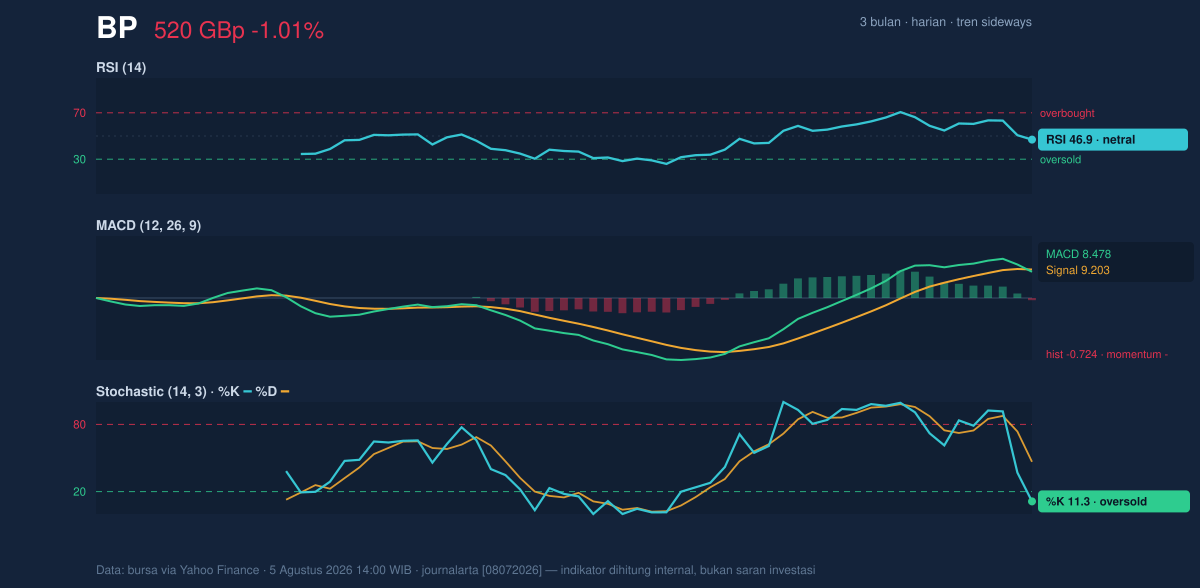
The more interesting signal is in the stochastic oscillator. %K at 11.3 versus %D at 46.6 places the stock in oversold territory, implying the recent drop has been fast enough to press short-term momentum to an extreme. Oversold does not mean “about to rise” on its own, but it does mean downside may be running ahead of confirmation. In practice, traders often wait for %K to turn back above %D before treating it as a real reversal signal.
MACD, however, is still working against that hope. MACD at 8.478 sits below the signal line at 9.203, and the histogram at -0.724 shows bearish momentum remains active. That negative histogram matters because it means the recent price softness is not just noise; the short-term trend is still under pressure even though the broader moving-average structure has not fully rolled over.
Volatility & Volume
Volatility is moderate rather than explosive, with ATR(14) at 17.08, or about 3.3% of price. That suggests BP can still move meaningfully in a session, but the market is not in a disorderly swing regime. Combined with the normal Bollinger width, it points to a stock that is coiling inside a range rather than breaking into a volatility event.
Volume adds a subtle but important twist. Last trading volume was 64,637,231, about 1.5× the 20-hour average of 42,936,071. Higher volume on a down day can mean two different things: either sellers are becoming more active, or the market is simply trading more heavily around a decision point. The fact that OBV is falling tilts that interpretation toward distribution — in other words, more shares appear to be changing hands on the way down than on the way up. That is a warning sign because price declines backed by weakening OBV often indicate that rallies are struggling to attract committed demand.
Key Levels & Scenarios
The immediate map is clear. Support at 481.80 is the first level that matters on the downside, while 555.90 is the first meaningful resistance on the upside. The 3-month range gives extra context: BP has traded between 575.70 and 450.60, so the current price is still comfortably above the lower end of that broader range, but well below the top.
If BP can recover 525.33 and hold above it, the chart would begin to look less corrective and more constructive, because that would mean price has reclaimed both the SMA20 and the Bollinger midline. If it fails to do so and instead loses 513.34, the SMA50 becomes the next key test; a break below that would weaken the significance of the golden cross and shift attention toward 481.80. A move through 555.90 would be the first sign that the range is being resolved to the upside, but until then the stock remains boxed in.
Technical Verdict: HOLD (wait & see)
HOLD (wait & see)
- Golden cross still supports the medium-term structure, but price is below SMA20 at 525.33, so near-term momentum has not confirmed the bullish signal.
- Stochastic is oversold at %K 11.3, yet MACD is negative with a -0.724 histogram, showing no confirmed reversal.
- Volume is 1.5× average and OBV is falling, which suggests participation is real but currently leaning to the downside.
Verdict invalidated if price breaks below 481.80.
- Ideal Entry Range: 513.34 to 525.33
- Exit Target: 555.90
- Stop Loss protection: 481.80
In plain English: BP is not broken, but it has not yet proved that the recent weakness is finished.
Summary Data BP
| Last price | 519.70 GBp |
| Change 1 day / 5 days / 1 month | -1.01% / -4.38% / 5.78% |
| Trend / MA-cross | sideways / golden |
| SMA20 / SMA50 | 525.33 / 513.34 |
| RSI (14) / Stochastic %K | 46.9 / 11.3 |
| Bollinger %B / ATR | 43% / 17.08 |
| Support / Resistance 20 days | 481.80 / 555.90 |
| Data as of | 5 Agustus 2026 14:00 WIB |

