DBS Stock Gains 0.78%, Testing Key Resistance In Focus
On Agustus 7, 2026: price 75.08 SGD, trend uptrend, RSI 63.1, support 70.23, resistance 75.00. technical analysis of dbs stock. DBS Stock Gains — full details…

DBS Group’s shares rose to 75.08 SGD on 5 August 2026, edging above the previous close of 74.50 as the stock pushed to the top of its recent range. The move matters less for the size of the gain than for where it happened: DBS is now trading above its SMA20 at 73.03 and well above its SMA50 at 68.17, a setup that keeps the broader trend pointed upward even as some shorter-term momentum readings begin to cool. In plain terms, the stock is still being carried by trend, but it is also approaching a zone where traders tend to test whether the advance has enough force to continue.
Trend & Price Action
The chart shows a stock that remains in an uptrend, with the SMA20 rising 2.35% over 5 days. That slope signals that the average price over the past month is still moving higher, which is usually a better sign than a flat or falling average because it shows buyers have been willing to pay up consistently. DBS is also trading above both its short- and medium-term averages, which means recent price action is still stronger than the longer backdrop. The absence of a new MA-cross is not a problem here; it simply means the trend has already been established rather than being freshly triggered by moving averages crossing over.
The more delicate part is location. The stock is sitting at 102% of its 20-hour range, effectively near the upper end of that band, and just under the 20-hour resistance at 75.00. That placement is important because a stock near the top of its range often needs either stronger participation or a pause before it can extend further. The 3-month high at 75.00 reinforces that this is not just a nearby chart level; it is the point where the market has already shown hesitation before.
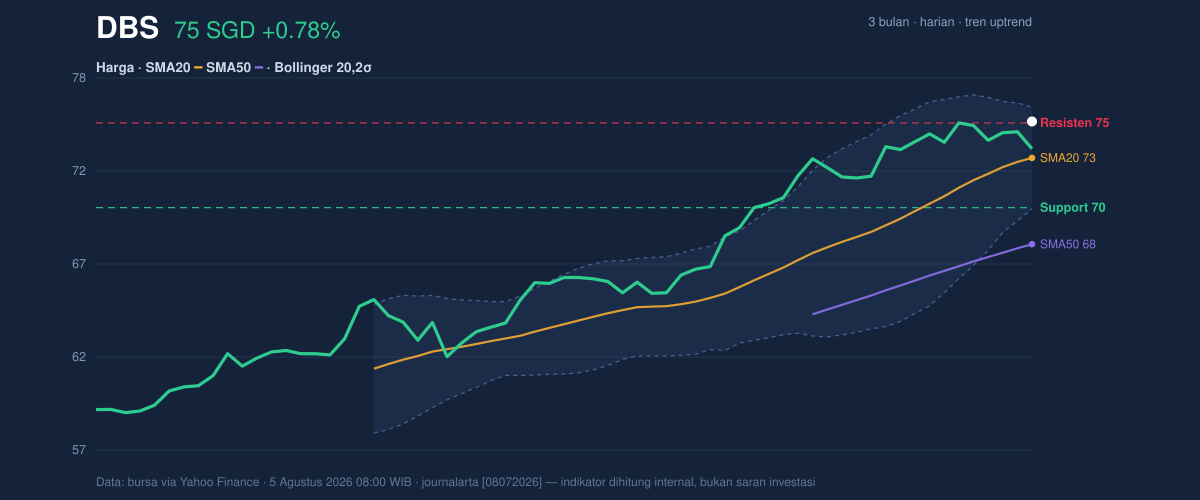
Put simply: the trend is healthy, but the stock is now pressing against a ceiling that has already mattered.
Oscillators & Momentum
The momentum picture is more mixed than the trend picture. The RSI(14) at 63.1 is still neutral, which means the stock is not yet in the kind of overbought territory that often signals an exhausted move. That leaves room for further upside, but it also suggests the rally is no longer early-stage. The Stochastic %K at 60.1 and %D at 77.0 are also neutral, but the gap between the two lines hints that near-term momentum has eased from its strongest point. In practical terms, Stochastic is saying the stock is not oversold and not stretched to the point of immediate concern, but it is also not showing the kind of clean acceleration that would usually accompany a decisive breakout.
The more cautionary signal comes from MACD. With MACD at 1.869 below its signal line at 2.099, and the histogram at -0.231, momentum is currently negative. That does not automatically mean the trend has broken; it means the pace of the advance is lagging the price structure. This kind of divergence often appears when a stock keeps rising, but the underlying push is less forceful than before. Traders watching the chart would read that as a warning that upside may need fresh volume to keep going.
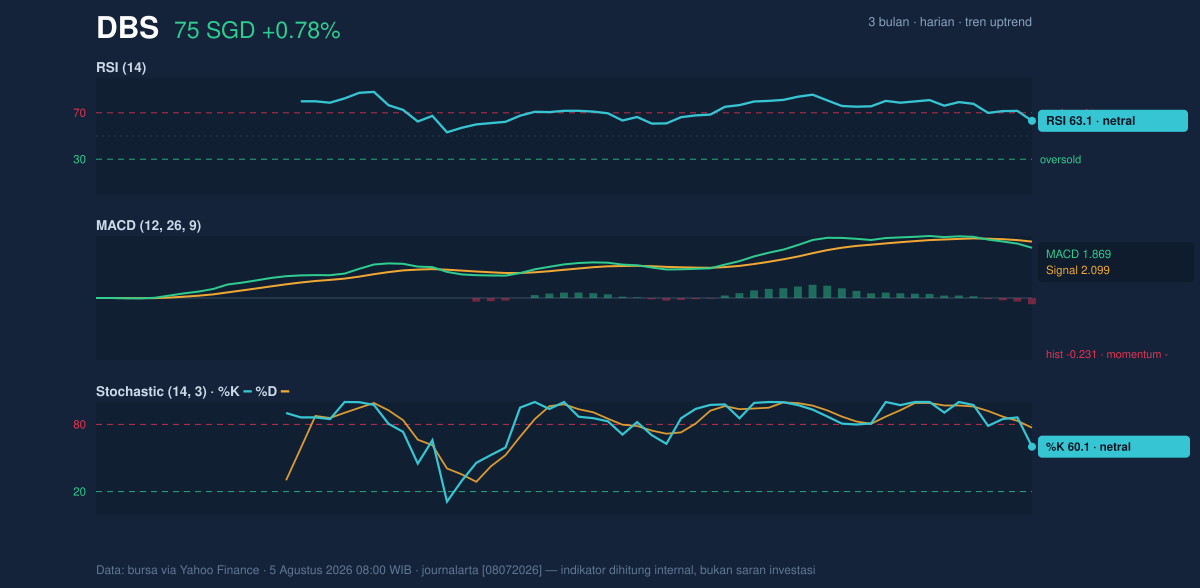
The message from the oscillators is simple: DBS is still constructive, but the burst of energy is not as strong as the price alone might suggest.
Volatility & Volume
Bollinger Bands add another layer to the story. DBS is trading near the upper band, with %B at 86%, while the bands themselves are relatively tight at 7.8%. That combination matters because a stock near the upper band is already leaning toward the expensive side of its recent statistical range, while a squeeze in band width often precedes a larger move. In other words, the chart is compressed even as price hugs the top of the range, which can lead to a breakout if buyers keep pressing — or a quick pullback if they fail to do so.
Volatility is subdued by historical standards. The ATR(14) at 1.10, or 1.5% of price, points to relatively low day-to-day movement. That usually means the market is not pricing in a large immediate swing, but low ATR during a squeeze can also make the next directional move more abrupt once it starts. Volume supports that idea only partially: the last session’s volume of 5,910,100 was about 1.3× normal, which shows participation improved, yet the OBV is down. OBV, or on-balance volume, tracks whether volume is flowing in a way that supports price. A falling OBV while price is near a high suggests not all of the trading flow is confirming the advance. That is a subtle but meaningful warning that the recent push may be running ahead of broad accumulation.
So the setup is not weak — but it is not clean either.
Key Levels & Scenarios
The immediate reference points are clear on the chart. Support sits at 70.23, which is the 20-hour support level and also close to the lower Bollinger band at 70.17. That cluster matters because it is where short-term buyers have previously shown up, and where a failure would suggest the recent advance has lost its base. On the upside, resistance is 75.00, which lines up with the recent high and the 3-month peak. A move through that area would not just be a new high; it would be the market proving it can escape a level that has already capped price.
If DBS holds above the 73.03 area and can settle above 75.00, the squeeze in Bollinger Bands suggests the next move could broaden quickly. If it fails there, the combination of negative MACD histogram and downtrending OBV would make a retreat toward 70.23 more plausible than a straight extension. The key is that the market is currently asking a question, not answering it.
Technical Verdict: HOLD (wait & see)
HOLD (wait & see)
- Trend is supportive: price remains above SMA20 at 73.03 and SMA50 at 68.17, with the SMA20 slope still rising.
- Momentum is not fully confirming: MACD is negative versus its signal line, while RSI 63.1 and Stochastic 60.1/77.0 are neutral rather than decisive.
- Volatility is compressed: Bollinger bands are squeezing and price is near the upper band, which raises the odds of a sharp move but does not yet define direction.
- Verdict invalidated if price breaks below 70.23, where short-term support and the lower volatility band converge.
Ideal entry range: 70.23 to 73.03
Exit target: 75.00 to 75.89
Stop loss protection: below 70.23
In plain English: DBS is still trending upward, but the chart is close to resistance and waiting for confirmation rather than assuming the next leg higher.
“The market is close to the door, but it has not yet shown whether it can push it open.”
Summary Data DBS
| Last price | 75.08 SGD |
| Change 1 day / 5 days / 1 month | 0.78% / 0.11% / 8.65% |
| Trend / MA-cross | uptrend / none |
| SMA20 / SMA50 | 73.03 / 68.17 |
| RSI (14) / Stochastic %K | 63.1 / 60.1 |
| Bollinger %B / ATR | 86% / 1.10 |
| Support / Resistance 20 days | 70.23 / 75.00 |
| Data as of | 5 Agustus 2026 08:00 WIB |


