On Agustus 7, 2026: price 160.10 HKD, trend uptrend, RSI 58.8, support 152.30, resistance 168.20. technical analysis of hsbc stock. Momentum Gains — full…
By matthew jonathan
August 6, 20265 min read
Momentum Gains, HSBC Stock Drops 3.84% Today
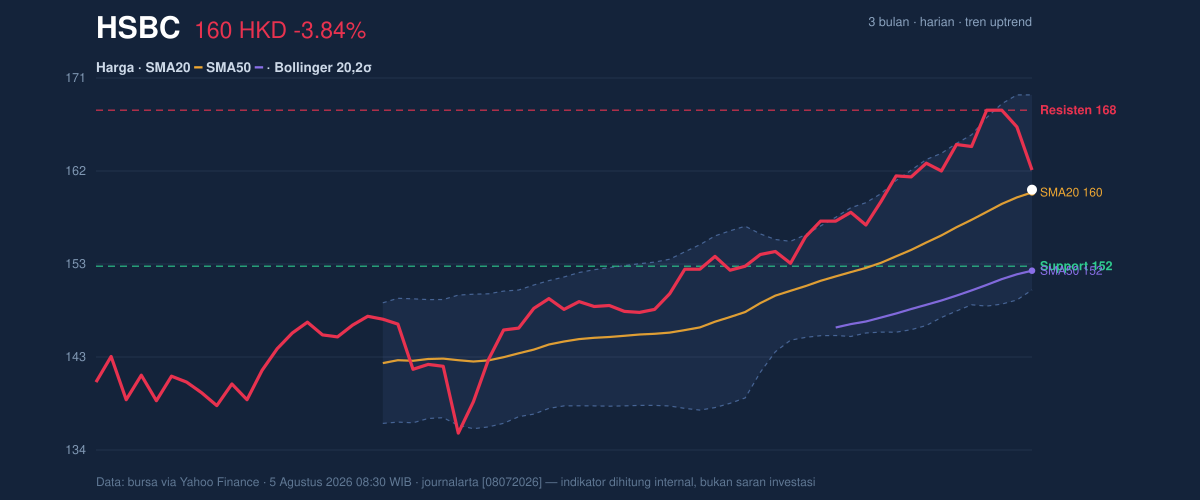
HSBC Holdings’ Hong Kong-listed shares last changed hands at HK$160.10, down 3.84% on the day and still sitting above both its SMA20 at 159.82 and SMA50 at 151.85, a combination that keeps the broader trend constructive even after the latest pullback. The move matters less as a standalone drop than as a test of whether buyers can keep defending the short-term moving average after a sharp one-day reset from 166.50. In plain terms, the chart is still pointing upward, but the stock is no longer stretching higher with the same ease.
Trend & Price Action
The trend structure remains positive because price is trading above the short-term average and the SMA20 is rising, with a 2.27% slope over 5 days. That slope is important: a rising moving average shows recent prices have been climbing fast enough to pull the trend line higher, which usually signals active demand rather than a dead-cat bounce. The lack of a fresh MA-cross means the market is not in a new trend regime; instead, it is working within an already-established uptrend. As shown in the chart, price is also near the middle of the Bollinger band rather than pressed against the upper edge, which suggests the rally has cooled without fully breaking down.
3-month price action chart of HSBC: price, SMA20/50, Bollinger, support & resistance. Data: exchange via Yahoo Finance.
The stock is trading at 49% of its 20-hour range, which is another way of saying it is roughly in the middle of the recent band between support and resistance. That placement is neutral, not weak. It tells readers the market has not yet chosen a decisive direction after the latest decline.
Oscillators & Momentum
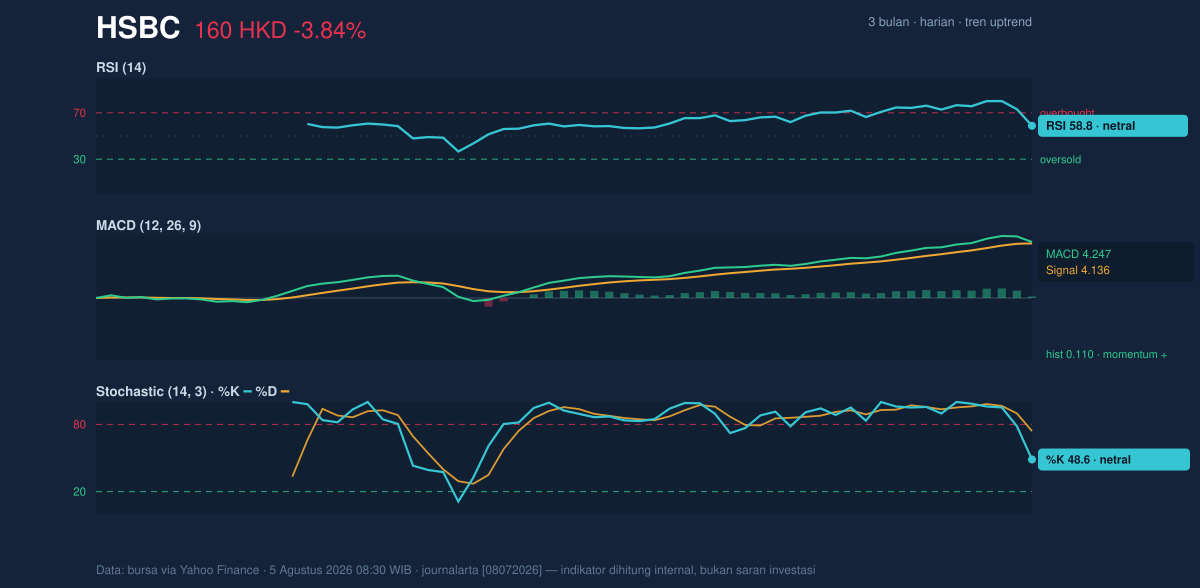
The momentum picture is mixed, and that is the key signal. RSI at 58.8 is still in neutral territory, meaning the shares are not overbought and there is room for further upside if buyers return. But the Stochastic %K at 48.6 versus %D at 74.1 shows short-term momentum has softened. Stochastic compares the latest price with its recent range; when %K sits below %D, it often means the latest move is losing speed even if the broader trend is intact. That is not a sell signal on its own, but it does warn that the stock has not yet regained strong upward traction.
The MACD, by contrast, is still leaning positive. MACD at 4.247 sits above the signal line at 4.136, with a 0.110 histogram. In practical terms, MACD above signal means the medium-term trend is still slightly ahead of its own average momentum, which supports the case that the recent drop is a pause rather than a trend break. The histogram is small, though, so the advantage is modest rather than forceful.
Momentum chart of HSBC: RSI(14), MACD, Stochastic. Data: exchange via Yahoo Finance.
Volatility & Volume
Bollinger bands are not flashing stress. The 12.4% band width is described as normal, while %B at 51% places the share price just above the middle of the band. That usually signals a balanced market: not compressed enough to imply an imminent breakout, and not extended enough to suggest exhaustion. The ATR(14) of 3.18, equal to 2.0% of price, also points to moderate day-to-day movement. For readers, ATR is a gauge of typical trading range; a 2.0% reading means swings are present, but not unusually violent.
Volume adds a more cautionary note. Last session’s 23,150,626 shares traded, about 1.6× the 20-hour average of 14,806,836, so the decline was not ignored by the market. Higher volume on a down day can mean stronger participation in the selloff, but the signal is tempered by the fact that OBV is down. OBV, or on-balance volume, tracks whether volume is flowing in the direction of price. A falling OBV while price still holds above key averages suggests distribution pressure is present beneath the surface, even if the uptrend has not yet broken.
Key Levels & Scenarios
The nearest support is 152.30 and the nearest resistance is 168.20. Those levels frame the current debate. If the shares can stabilize above the SMA20 at 159.82, the market has room to retest the upper part of the range and the 169.75 Bollinger upper band, which sits close to the 3-month high of 169.70. If price fails to hold the short-term average and instead drifts toward 152.30, the tone would shift from consolidation to a more meaningful retracement. The gap between current price and support is wide enough to matter; it is the level where the recent uptrend would need to prove itself.
The core message is that HSBC’s trend remains upward, but momentum has cooled enough that the next move depends on whether buyers can defend the short-term average rather than simply rely on the longer-term trend.
Technical Verdict: HOLD (wait & see)
- Reason 1: Price remains above SMA20 and SMA50, and the SMA20 slope is rising, which keeps the trend positive.
- Reason 2:MACD is above its signal line, but the small histogram shows only limited momentum advantage.
- Reason 3:RSI is neutral and Stochastic is soft, while OBV is down, so the chart lacks strong confirmation for immediate continuation.
- Verdict invalidated if price breaks below 152.30, the stated support.
- Ideal Entry Range: HK$159.82 to HK$152.30
- Exit Target (Target Price): HK$168.20 to HK$169.75
- Stop Loss protection: Below HK$152.30, with tighter protection near HK$159.82 for shorter-term positioning
For non-traders: the chart is still healthy, but it needs a stronger follow-through before the recent dip can be treated as anything more than a pause.
The latest 3-month high is 169.70.