Momentum Weakens, AstraZeneca Stock Gains 0.94% Today
On Agustus 7, 2026: price 11,850.00 GBp, trend downtrend, RSI 38.8, support 11,500.00, resistance 13,354.00. technical analysis of astrazeneca stock.

According to Yahoo Finance data for 5 August 2026 at 14:00 WIB, AstraZeneca shares on the LSE were 11,850.00 GBp, up 0.94% on the day but still sitting well below the short- and medium-term trend measures. That small bounce matters less than the larger pattern: the stock is still in a downtrend, with price below the SMA20 at 12,573.60 and the SMA50 at 13,273.80, while the 20-day moving average is still sloping down at -4.22% over five days. In plain terms, the shares are trying to stabilise, but the chart is still being pulled lower by the recent sell-off.
Trend & Price Action
As shown in the chart, AstraZeneca is trading near the lower end of its recent range rather than in a clean recovery pattern. The price is only 19% of the way up the 20-day range, with 11,500.00 acting as nearby support and 13,354.00 as the nearest resistance. That placement is important because it tells us the market has not yet reclaimed the area where buyers previously lost control. The shares are also still below the middle Bollinger band at 12,573.60, which is the same level as the SMA20, so the stock has not yet crossed back above the short-term trend line. The lack of a fresh MA cross means there is no new moving-average confirmation that the trend has turned.
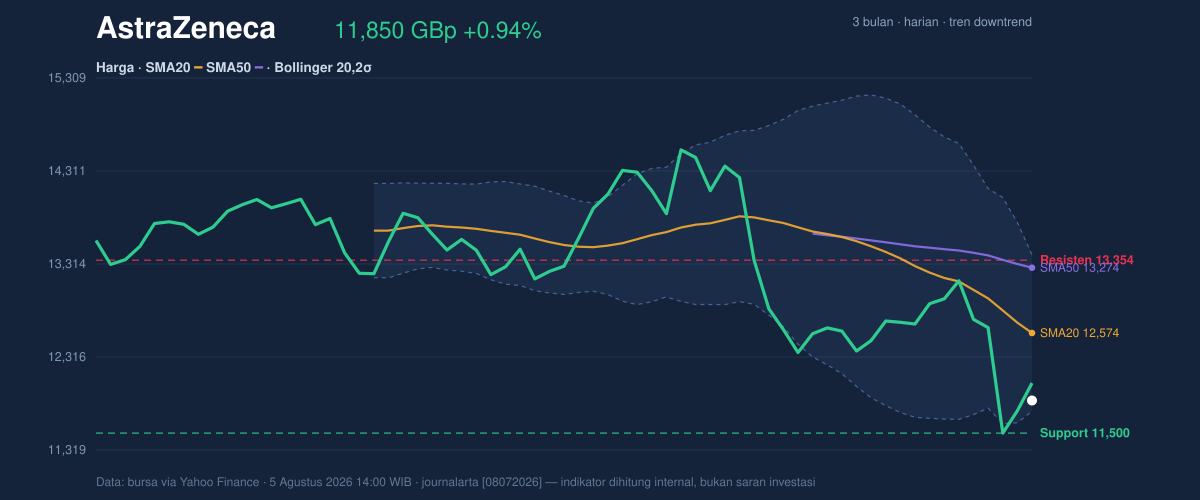
The broader backdrop is also mixed. AstraZeneca’s 3-month high of 15,126.00 and 3-month low of 9,892.00 show that the stock has already travelled a wide distance, but the current price still sits much closer to the lower half of that band. That is a sign of damage, not yet repair. The daily gain may suggest bargain-hunting, yet the five-day move of -9.78% and one-month slide of -16.78% show that recent sellers have been more forceful than buyers.
Oscillators & Momentum
The momentum picture is less extreme than the trend picture, but it is still weak. The RSI at 38.8 is technically neutral, which means the stock is not deeply oversold, but it is close enough to the lower zone to show that downward pressure has not fully faded. The Stochastic %K at 57.3 and %D at 50.8 are also neutral, suggesting the latest bounce has not yet developed into a strong momentum shift. In other words, the stock has stopped falling in a straight line, but it has not yet built the kind of momentum that usually accompanies a durable reversal.
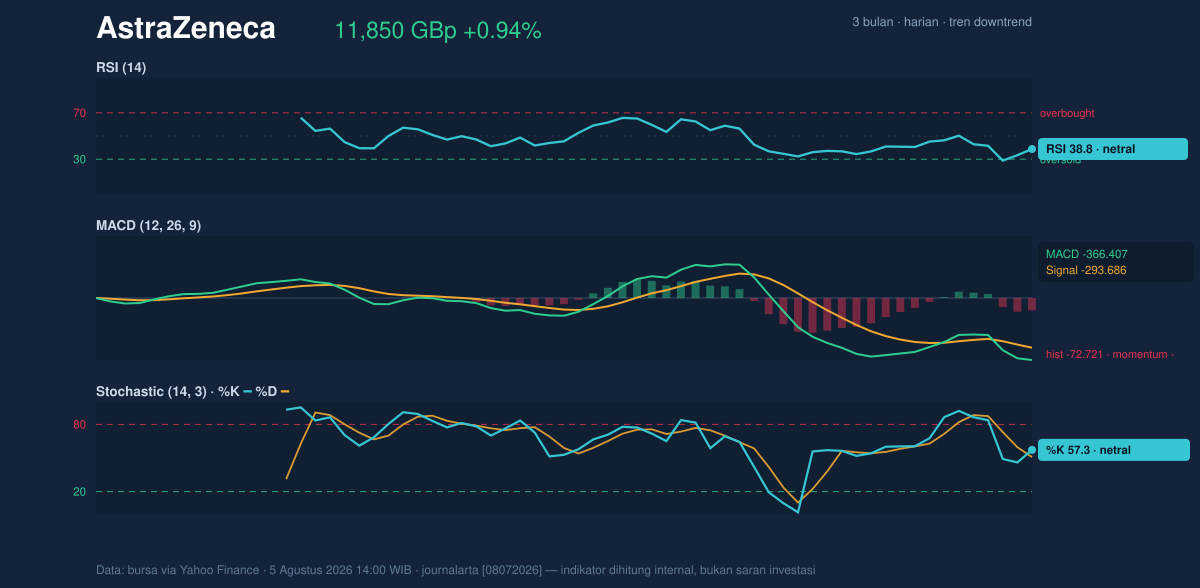
The clearest warning comes from the MACD at -366.407, still below its signal line at -293.686, with a histogram of -72.721. For readers less familiar with the term, MACD is a trend-following indicator: when it is below the signal line and the histogram is negative, it means downward momentum still dominates even if price has bounced for a day. That matters because it says the recent uptick is not yet strong enough to flip the broader momentum structure. The chart is therefore showing a market that is trying to base, but has not proven it can sustain an advance.
Volatility & Volume
Volatility remains elevated. The ATR(14) at 571.51, equal to 4.8% of price, indicates that AstraZeneca can still move sharply in either direction over a short period. That makes the current setup more fragile: even modest headlines or sector moves could push the share price through nearby support or resistance. The Bollinger Bands reinforce that message. The band width is 13.3%, described as normal, so this is not a compression setup where a breakout is being tightly coiled. Instead, the stock is trading near the lower edge of the band structure, with %B at 7%, which means price is very close to the lower band at 11,734.91. That often signals stretched weakness, but not necessarily an immediate rebound.
Volume adds a more constructive nuance. The latest session traded 6,337,651 shares, about 1.6× the 20-day average of 4,043,978. Higher volume on a bounce can indicate that some buyers are willing to step in. But the OBV is still falling, which is the more important message: on-balance volume tracks whether volume is accumulating behind the move, and a declining OBV suggests the broader flow of money has not yet turned supportive. So while participation picked up, it has not yet overpowered the earlier distribution pattern.
Key Levels & Scenarios
The nearest technical floor is 11,500.00, and the lower Bollinger band at 11,734.91 sits just above it. That cluster is the first area where buyers are likely to defend the chart. If the share price fails there, the market would be signalling that the current bounce is only a pause inside the downtrend. On the upside, the first meaningful barrier is 12,573.60, where the SMA20 and Bollinger midline meet. That level matters because a move back above it would show the stock has reclaimed its short-term trend. Above that, 13,354.00 and the SMA50 at 13,273.80 form the next resistance zone, where longer-term sellers may reappear.
The core signal is that AstraZeneca is still below both key moving averages, with negative MACD and a falling OBV, even though volume has picked up on a small rebound. That combination usually means the market is testing for support rather than confirming a reversal. The technical picture improves only if price can hold above the lower band and then recover the SMA20; until then, the chart remains under pressure.
Technical Verdict: HOLD (wait & see)
HOLD (wait & see) because the trend remains down, MACD is negative, and OBV is still falling, even though the session saw a higher-than-average volume bounce. The stock is also still trading below the SMA20 and SMA50, so the burden of proof remains with buyers.
- Ideal Entry Range: 11,734.91 to 12,573.60, using the lower Bollinger band and SMA20 as the first recovery zone.
- Exit Target (Target Price): 13,273.80 to 13,354.00, where the SMA50 and 20-day resistance cluster.
- Stop Loss protection: below 11,500.00, as a break of support would weaken the current base.
The verdict is invalidated if price breaks below 11,500.00. For non-traders, that means the shares are not showing enough technical strength yet to confirm a proper recovery.
Volume last session: 6,337,651 shares.
Summary Data AstraZeneca
| Last price | 11,850.00 GBp |
| Change 1 day / 5 days / 1 month | 0.94% / -9.78% / -16.78% |
| Trend / MA-cross | downtrend / none |
| SMA20 / SMA50 | 12,573.60 / 13,273.80 |
| RSI (14) / Stochastic %K | 38.8 / 57.3 |
| Bollinger %B / ATR | 7% / 571.51 |
| Support / Resistance 20 days | 11,500.00 / 13,354.00 |
| Data as of | 5 Agustus 2026 14:00 WIB |

