Momentum Weakens, HSBC Stock Drops 4.00% Today
On Agustus 7, 2026: price 1,521.20 GBp, trend sideways, RSI 50.0, support 1,456.40, resistance 1,597.40. technical analysis of hsbc stock.

1,521.20 GBp is where HSBC Holdings finished its latest session on the London market, down 4.00% on the day and back almost exactly to its 20-day average, a level that often acts like a short-term pivot. That matters because the share is no longer pushing higher with conviction: the price is sitting in a sideways pattern, the momentum gauges are mixed, and volume jumped to 1.6× the 20-hour average even as the on-balance volume trend fell, a combination that suggests active trading but not necessarily sustained buying.
Trend & Price Action
The chart shows HSBC trading at 1,521.20 GBp, just below the SMA20 at 1,522.96 and well above the SMA50 at 1,453.61. That placement is important: the longer average still points to a constructive medium-term structure, but the market is struggling to hold the shorter trend line. In plain terms, the shares are not in a clear downtrend, yet they have lost the immediate upward rhythm that usually keeps pullbacks shallow.
The broader pattern is sideways, and the SMA20 slope of 1.96% over 5 days shows the short-term trend is rising only modestly. There has been no fresh MA-cross, so the chart is missing the kind of moving-average signal that would confirm a stronger directional shift. The price is also sitting at 46% of the 20-hour range, which places it in the middle rather than near either edge of the recent trading band.
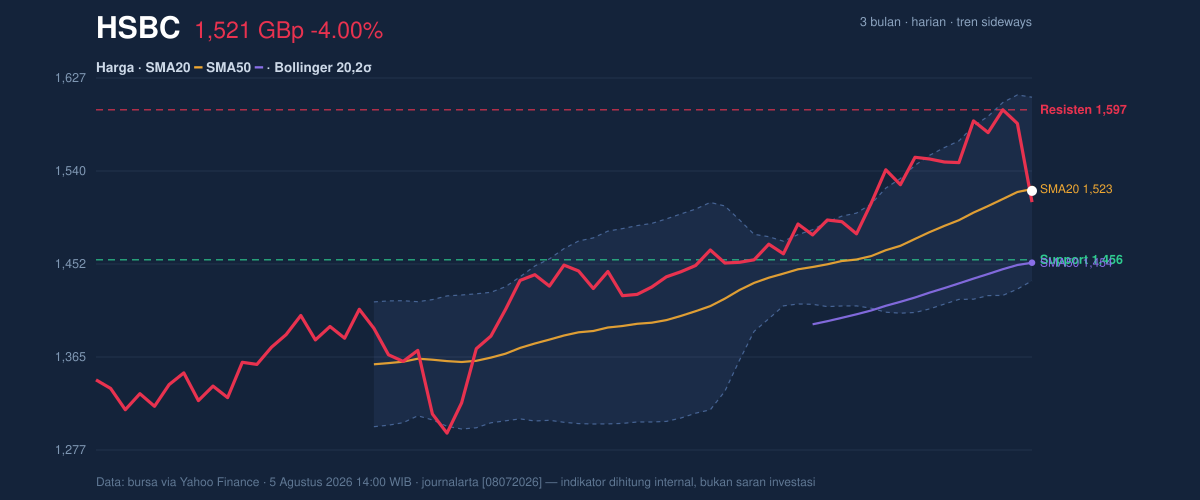
That middle-of-the-range position usually means the market is waiting for a catalyst.
Oscillators & Momentum
The momentum picture is neutral on the surface but softer underneath. RSI(14) at 50.0 is the classic midpoint reading: neither overbought nor oversold, and therefore not a strong signal by itself. But the Stochastic %K at 61.8 versus %D at 83.1 shows short-term momentum has cooled from a stronger position. In practical terms, that gap says the recent bounce is losing urgency; the faster line has slipped below the slower one, which often happens when a rally pauses or begins to roll over.
The more telling signal is the MACD at 33.477 below the signal line at 34.923, with a histogram of -1.446. MACD is a trend-following momentum tool, and when it sits below its signal line, it implies the recent price move is weakening relative to its prior pace. That does not automatically mean a major decline is underway, but it does mean the chart is not currently confirming fresh upside.
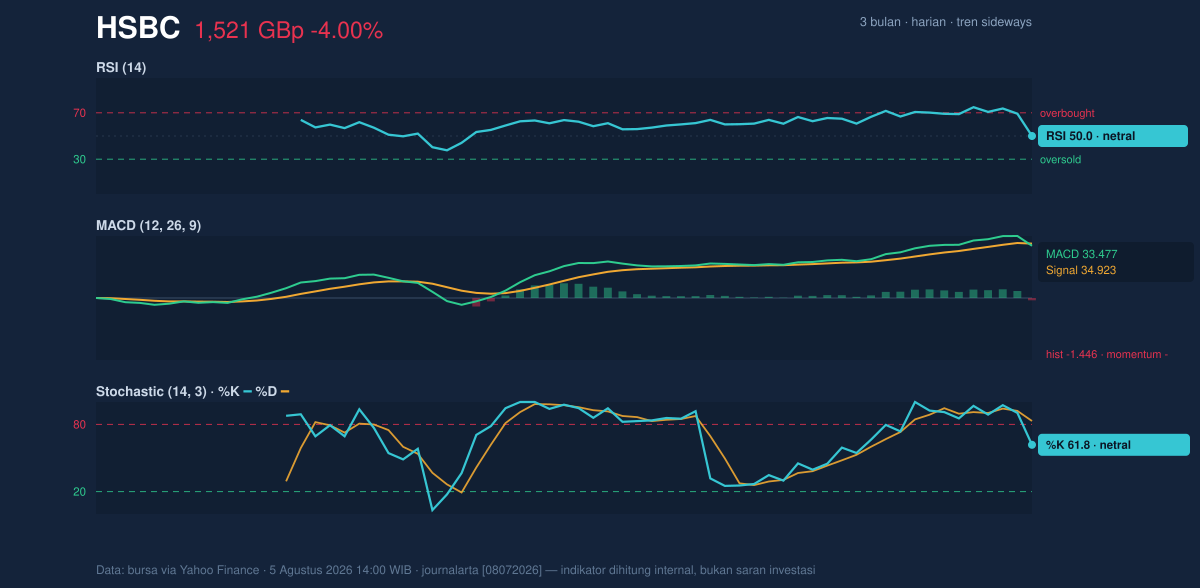
So the oscillators are not screaming “sell,” but they are also not backing a strong continuation move.
Volatility & Volume
Bollinger Bands help frame where the price sits relative to its recent statistical range. HSBC is trading near the band midpoint, with the middle band at 1,522.96, the upper band at 1,609.28 and the lower band at 1,436.64. The %B reading of 49% reinforces that the shares are almost exactly in the center of the range. That usually signals balance, not breakout pressure.
The Bollinger width of 11.3% is described as normal, so there is no squeeze suggesting an imminent volatility burst, and no expansion suggesting a trend already in motion. The ATR(14) of 46.24, equal to 3.0% of price, says daily movement is moderate. That matters because a 4.00% drop is large enough to be meaningful, but not so large that it necessarily changes the entire structure on its own.
Volume, however, adds a cautionary note. The latest print of 36,529,759 shares was 1.6× the 20-hour average of 22,560,065, which means the decline happened with strong participation. When volume rises on a down day and OBV is falling, it often suggests that selling pressure is being accepted rather than ignored. In other words, the market is trading actively, but the balance of that activity is not clearly favorable to the bulls.
Key Levels & Scenarios
The nearest technical markers matter more now than the daily percentage change. The 20-hour support at 1,456.40 is the first line that would show whether the current pullback is only a pause or the start of something deeper. On the upside, the 20-hour resistance at 1,597.40 is the first ceiling that would need to give way before the chart can reassert a stronger rebound. The wider three-month range also frames the story: the stock is trading below the 3-month high of 1,610.00 and well above the 3-month low of 1,267.20, which means the shares are still in the upper half of their broader range even after the setback.
If HSBC holds above the mid-1,450s, the market can still treat this as a consolidation phase inside a larger range. If it loses that area, the chart would start to look less like a pause and more like a break in structure. If it reclaims 1,597.40, the recent weakness would look more like a shakeout than a trend change.
Technical Verdict: HOLD (wait & see)
HOLD (wait & see)
- RSI at 50.0 and Stochastic at 61.8/83.1 point to neutral momentum, not a clean directional edge.
- MACD below signal with a -1.446 histogram shows the near-term trend is losing force.
- Price sitting just below the SMA20 at 1,522.96 while still above the SMA50 at 1,453.61 keeps the chart balanced rather than broken.
Verdict invalidated if price falls below 1,456.40, the 20-hour support that currently anchors the range.
- Ideal entry range: 1,456.40 to 1,522.96
- Exit target: 1,597.40 to 1,609.28
- Stop loss protection: below 1,436.64
For non-traders, this means HSBC’s chart is still stable enough to watch, but not strong enough to call a fresh upward move yet.
The latest 20-hour support remains 1,456.40.
Summary Data HSBC
| Last price | 1,521.20 GBp |
| Change 1 day / 5 days / 1 month | -4.00% / -1.72% / 4.62% |
| Trend / MA-cross | sideways / none |
| SMA20 / SMA50 | 1,522.96 / 1,453.61 |
| RSI (14) / Stochastic %K | 50.0 / 61.8 |
| Bollinger %B / ATR | 49% / 46.24 |
| Support / Resistance 20 days | 1,456.40 / 1,597.40 |
| Data as of | 5 Agustus 2026 14:00 WIB |

