OCBC Stock Gains 2.12%, Momentum Weakens In Focus
On Agustus 7, 2026: price 29.33 SGD, trend uptrend, RSI 60.2, support 27.32, resistance 29.78. technical analysis of ocbc stock. OCBC Stock Gains — full…

OCBC Bank’s shares on SGX rose to 29.33 SGD, up 2.12% from the previous close of 28.72, but the move is happening inside a more mixed technical picture. The stock is still in an uptrend, with price sitting above the SMA20 at 28.64 and well above the SMA50 at 26.14, yet the latest push has run into the upper end of its recent trading band, as shown in the chart. That matters because an uptrend is not just about being above moving averages; it is about whether buyers can keep extending gains without losing participation.
Trend & Price Action
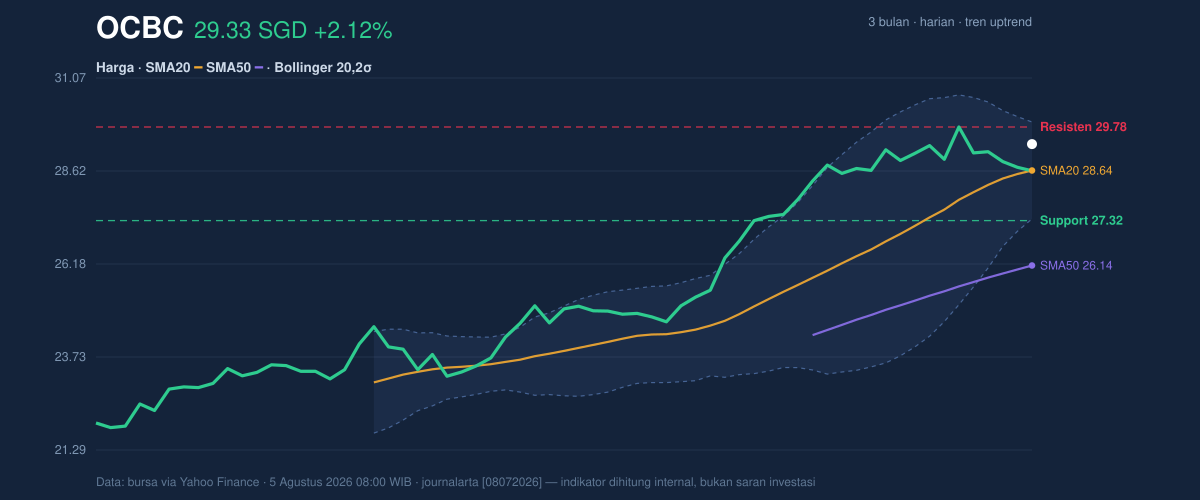
The structure remains constructive, but not without friction. The price is above the SMA20, and the SMA20 slope of 2.77% over 5 days signals that short-term trend support is still rising. That is usually a healthy sign, because it suggests the market has been willing to pay progressively higher prices rather than merely bouncing from a one-off dip. The absence of a fresh MA-cross means the chart is not flashing a new trend acceleration signal; instead, it is showing an existing trend that is still intact but not newly confirmed.
The stock is also trading near the top of its recent range. With 20-hour resistance at 29.78 and the 3-month high at 29.78, OCBC is pressing against a level that has already capped the advance. That makes the current move more sensitive to whether buyers can absorb supply at the highs. The fact that price is at 82% of the 20-hour range says the market is already leaning toward the upper end of its short-term band, leaving less room before overhead resistance becomes the next test.
Oscillators & Momentum
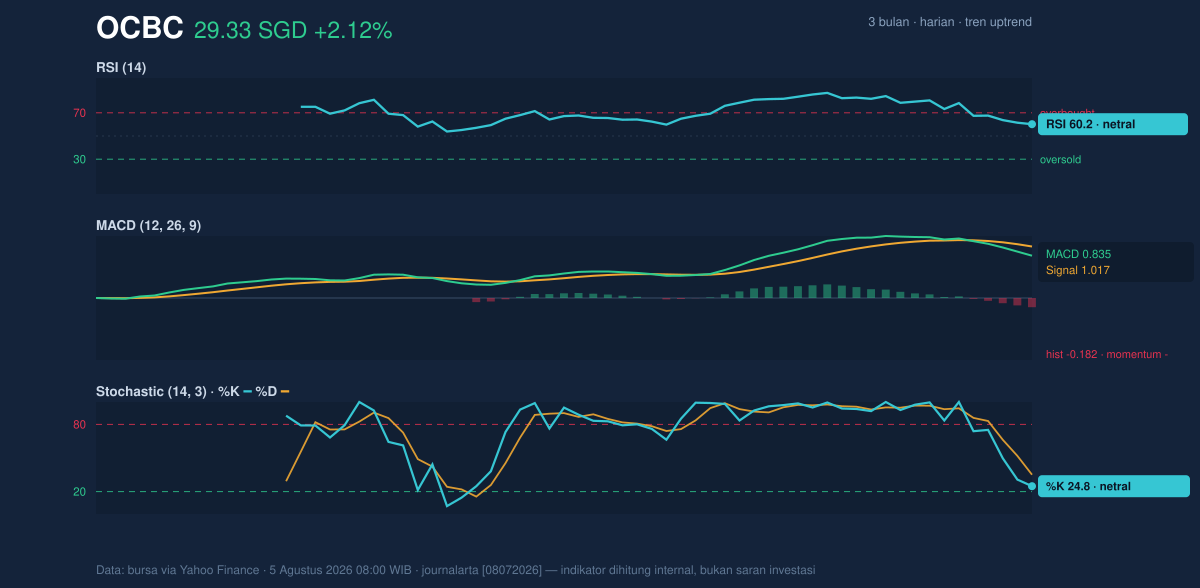
Momentum is more cautious than the trend line alone would suggest. The RSI at 60.2 is neutral, which means the stock is not stretched into classic overbought territory even after the recent rise. That is a useful signal: it leaves room for further upside if buying interest improves. But the Stochastic %K at 24.8 and %D at 35.1 are also neutral and sitting lower than the RSI, which hints that the most recent lift has not yet produced a strong momentum breakout. In plain language, price is firm, but the shorter-term oscillator is not fully enthusiastic.
The bigger caution comes from the MACD at 0.835 sitting below its signal line at 1.017, with a histogram of -0.182. That negative histogram means the faster trend measure is still lagging the slower one, so the rally has not fully converted into confirmed bullish momentum. This is the key divergence in the chart: price is rising, but momentum is not yet matching the strength of the move. When that happens, advances can continue, but they often need fresh volume or a clean break above resistance to avoid stalling.
Volatility & Volume
The Bollinger setup is also telling a balanced story. Price is near the upper band, with %B at 77%, which means OCBC is trading in the upper portion of its recent volatility envelope but not at an extreme. The upper band at 29.91 is close enough to the current price that the market is testing the ceiling of the recent range, while the band width of 8.9% is normal rather than compressed. That matters because a squeeze would imply an imminent expansion; here, the market is already moving within a standard volatility regime, so follow-through depends more on participation than on an imminent volatility release.
Participation, however, is not especially strong. Last volume was 5,621,600, below the 20-hour average of 6,536,390, or 0.9x normal. That tells us the latest rise was not powered by unusually heavy trading. The OBV is down, which is a subtle but important warning: on-balance volume tracks whether volume is accumulating behind price advances, and a falling OBV suggests the rally is not yet broadly supported. Put simply, the shares are climbing, but the tape is not showing decisive accumulation.
Key Levels & Scenarios
The immediate battleground is clear. 29.78 is the nearest resistance and also the 3-month high, so a sustained move through that level would mark a meaningful technical change. Below, 27.32 is the nearest support, and it sits well above the SMA20 at 28.64 only in the sense that the price has room to retrace before the trend structure is damaged. The lower Bollinger band at 27.36 closely tracks that support, reinforcing the idea that this area is the first meaningful line of defense.
If price breaks above 29.78, the chart would be signaling that the recent ceiling has given way, and the next focus would be whether the move can hold above the upper band near 29.91. If price fails to hold 27.32, the short-term uptrend would look more vulnerable, especially with OBV down and MACD negative already showing that momentum is not fully aligned.
Technical Verdict: HOLD (wait & see)
The chart does not justify a clean bullish or bearish call. Price is above the SMA20 and SMA50, which keeps the broader structure constructive. MACD remains below its signal line, so momentum is not confirming the latest rise. Volume is below average and OBV is down, which weakens the case for a decisive breakout attempt.
- Ideal Entry Range: 27.32 to 28.64
- Exit Target (Target Price): 29.78 to 29.91
- Stop Loss protection: below 27.32
The verdict is invalidated if price breaks below 27.32.
In plain English, OCBC looks steady, but the chart wants proof before it can be treated as a stronger trend continuation.
Summary Data OCBC
| Last price | 29.33 SGD |
| Change 1 day / 5 days / 1 month | 2.12% / -1.51% / 9.48% |
| Trend / MA-cross | uptrend / none |
| SMA20 / SMA50 | 28.64 / 26.14 |
| RSI (14) / Stochastic %K | 60.2 / 24.8 |
| Bollinger %B / ATR | 77% / 0.53 |
| Support / Resistance 20 days | 27.32 / 29.78 |
| Data as of | 5 Agustus 2026 08:00 WIB |

