Shell Stock Technicals Today: Drops 0.20%, Momentum Gains
On Agustus 7, 2026: price 3,315.00 GBp, trend uptrend, RSI 55.5, support 3,038.50, resistance 3,405.50. technical analysis of shell stock.

Shell plc edged lower on the London Stock Exchange on 5 August 2026, with the shares last changing hands at 3,315.00 GBp, a modest slip from the previous close of 3,321.50. The move leaves the stock still trading in an established uptrend, but near enough to the upper half of its recent range that the market is now testing whether momentum can keep carrying price higher, or whether the latest advance is starting to lose some of its force.
Trend & Price Action
The broad structure remains constructive. Shell is trading above its SMA20 at 3,241.08 and above its SMA50 at 3,136.01, which tells readers the short-term trend is still aligned with the medium-term trend rather than fighting it. In plain language, price is sitting above both its recent average and its longer recent average, a setup that usually signals buyers have not yet lost control.
The key nuance is that the stock is no longer early in the move. At 3,315.00 GBp, Shell is positioned around 75% of the 20-hour range, with support at 3,038.50 and resistance at 3,405.50. That placement matters because it shows the market is closer to the ceiling than the floor. The gap to resistance is still manageable, but it also means fresh upside needs confirmation rather than assumption.
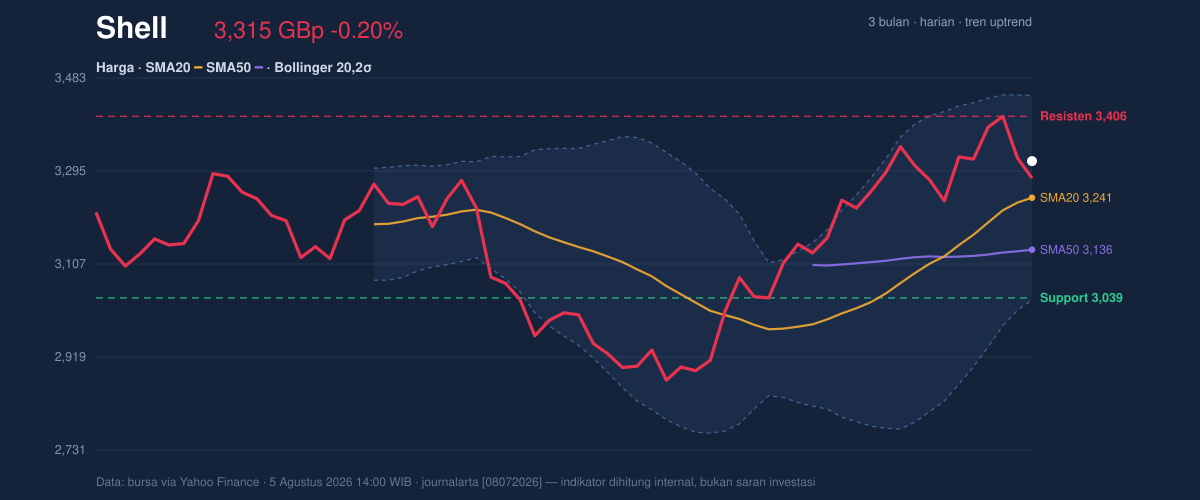
As shown in the chart, the price above SMA20 and SMA50 keeps the trend intact, while the Bollinger middle band at 3,241.08 acts like a line of balance between expansion and exhaustion. The Bollinger upper band at 3,447.91 is the next technical area where strength would need to prove itself. The 12.8% band width suggests conditions are normal rather than compressed, so the market is not sitting in a tight coil that usually precedes a sharp breakout; instead, it is already moving within a steady, orderly channel.
Oscillators & Momentum
The momentum picture is more restrained than the trend picture. RSI at 55.5 is neutral, which is important because it says the stock is not overbought even after the recent monthly gain of 7.65%. That leaves room for continuation, but it also means momentum is not stretched enough to force a quick breakout.
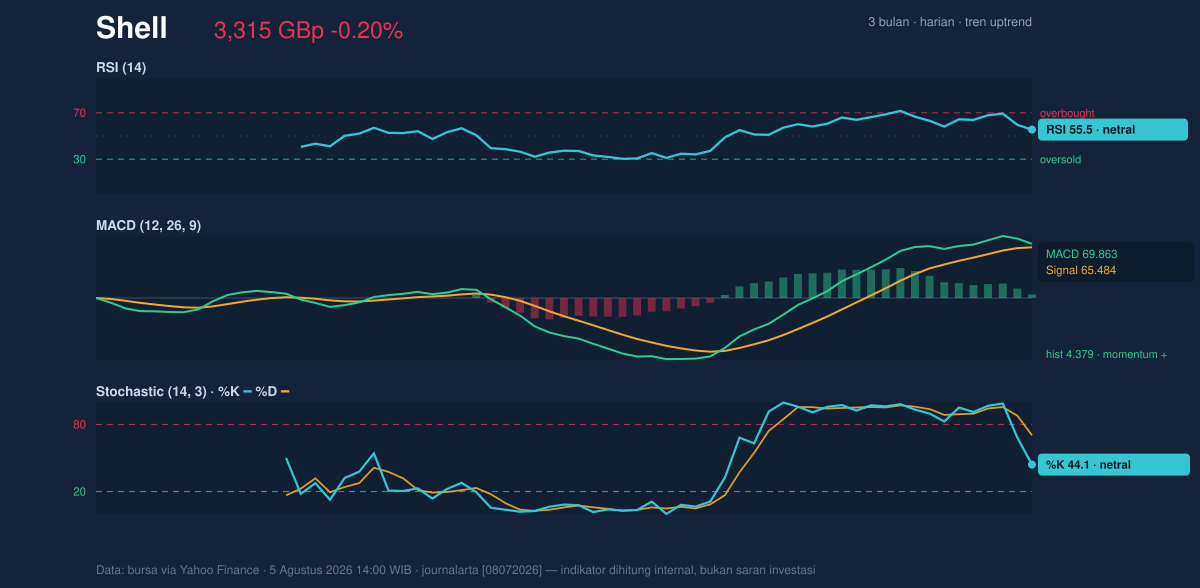
The Stochastic reading of 44.1 / 70.3 is also neutral, though the lower %K beneath %D suggests the short-term pace has cooled from earlier strength. This does not yet signal a reversal on its own, but it does imply the stock may need fresh buying pressure to re-accelerate. The most encouraging element is the MACD at 69.863 above its signal line at 65.484, with a positive histogram of 4.379. That combination means trend momentum is still positive, even if the faster oscillators are not shouting “overbought” or “breakout” just yet.
In other words, Shell has trend support from the MACD, but the RSI and Stochastic say the move is not running hot. That is often a healthy configuration for a trend that is still alive, but it also means the market is waiting for either a stronger push through resistance or a pause back toward support.
Volatility & Volume
Volatility is present, but not extreme. ATR(14) at 79.54, equal to 2.4% of price, points to moderate daily movement. That matters because it frames how much room the shares may have to travel without the move being unusual. A moderate ATR also suggests traders should expect movement, but not disorder.
Volume gives a more complicated signal. Last session’s volume of 17,013,151 was about 1.9× the 20-hour average of 9,164,598, which usually indicates strong participation and real interest in the name. But the OBV is falling, and that divergence is worth attention. OBV, or on-balance volume, tracks whether volume is flowing into up days or down days; when it declines even as price remains firm, it can mean the latest gains are not being broadly confirmed by accumulation.
That combination is subtle but important: heavy trading alone does not guarantee conviction. The surge in volume says Shell is active and widely watched, while the falling OBV warns that some of that activity may be distribution rather than sustained buying. As shown in the chart, this makes the current price zone more sensitive; strong turnover can either fuel a breakout or mark a transfer of ownership near resistance.
Key Levels & Scenarios
The immediate technical map is clear. Resistance at 3,405.50 is the first level that needs to give way for the recent advance to extend meaningfully. Above that, the Bollinger upper band at 3,447.91 becomes the next visible test. On the downside, support at 3,038.50 is the main line to watch, and the SMA20 at 3,241.08 is the nearer pivot that helps define whether the trend remains comfortably intact or starts to weaken.
The stock’s 3-month high of 3,758.50 and 3-month low of 2,559.50 show there is still a wide historical range beneath and above the current price. That wider context matters because Shell is not at an extreme, but it is also not cheap in technical terms; it sits in the middle-to-upper part of its recent multi-month band, where confirmation becomes more important than momentum alone.
Technical Verdict: HOLD (wait & see)
Shell’s chart supports a HOLD (wait & see) reading because the trend is still positive, but the momentum evidence is mixed enough to avoid calling it a clean breakout setup.
- MACD remains positive, with the line above the signal and a positive histogram, which supports the uptrend.
- Price is above SMA20 and SMA50, keeping the trend structure constructive.
- RSI and Stochastic are neutral, while OBV is falling, which weakens confirmation at current levels.
- Verdict invalidated if price breaks below 3,038.50, because that would damage the near-term support structure and weaken the trend thesis.
- Ideal Entry Range: 3,241.08 to 3,038.50
- Exit Target: 3,405.50 to 3,447.91
- Stop Loss Protection: below 3,038.50
For non-traders, this means Shell still looks technically healthy, but the market has not yet proven that the latest strength is strong enough to clear the next barrier. “We’re not seeing panic, but we’re not seeing full conviction either,” one London trader said, “and that matters when the stock is sitting this close to resistance.”
Summary Data Shell
| Last price | 3,315.00 GBp |
| Change 1 day / 5 days / 1 month | -0.20% / -0.26% / 7.65% |
| Trend / MA-cross | uptrend / none |
| SMA20 / SMA50 | 3,241.08 / 3,136.01 |
| RSI (14) / Stochastic %K | 55.5 / 44.1 |
| Bollinger %B / ATR | 68% / 79.54 |
| Support / Resistance 20 days | 3,038.50 / 3,405.50 |
| Data as of | 5 Agustus 2026 14:00 WIB |

