Tencent Momentum Gains: Stock Drops 1.72% (Agustus 7, 2026)
On Agustus 7, 2026: price 479.20 HKD, trend uptrend, RSI 61.7, support 434.60, resistance 492.20. technical analysis of tencent stock. Tencent Momentum Gains —…

Tencent Holdings slipped on the Hong Kong exchange on 5 August, with 0700.HK last changing hands at HKD 479.20, down from HKD 487.60, even as the broader technical picture still points to an established uptrend. The move matters because it comes with the stock sitting above its short- and medium-term trend markers, but also close enough to resistance that momentum is starting to look stretched. In plain terms: Tencent is still climbing the staircase, but it has reached a landing where traders often pause.
Trend & Price Action
The structure remains constructive. The share price is holding above SMA20 at HKD 465.46 and SMA50 at HKD 452.46, which keeps the trend aligned upward rather than broken. The SMA20 slope of 1.79% over 5 days signals that the short-term trend is still rising, and that is usually more important than one negative session. There is no new MA-cross, which means the moving averages are not giving a fresh acceleration signal, but they are also not warning of a trend reversal.
The stock is trading near the upper part of its recent band, with support at HKD 434.60 and resistance at HKD 492.20. At 77% of the range, price is closer to the ceiling than the floor, which tells us upside progress has already been substantial and the next move may need stronger confirmation to extend. The 3-month high at HKD 497.80 sits just above current resistance, so the market is testing an area where sellers have recently shown up.
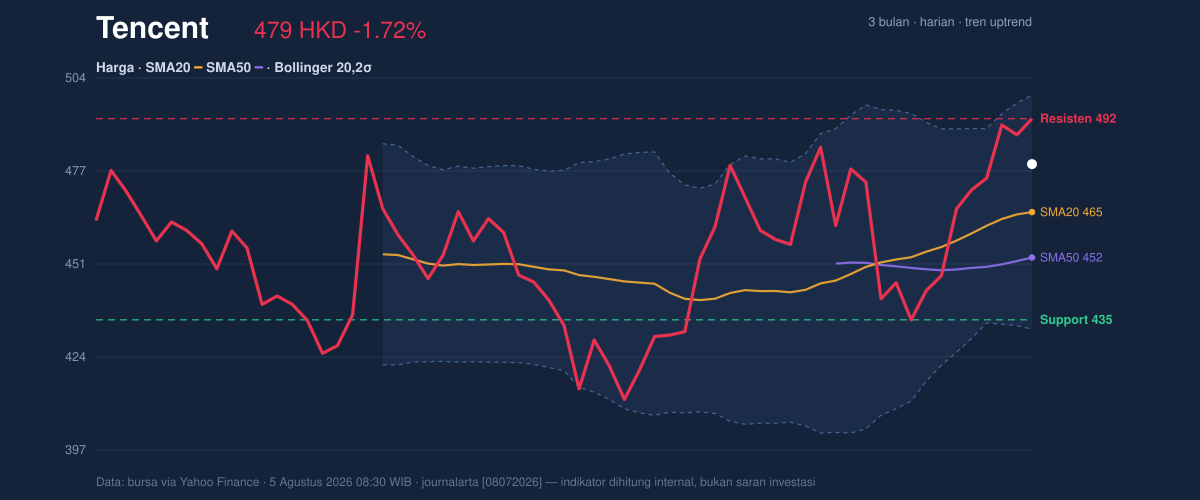
That is where the chart becomes important: the price is not weak, but it is no longer cheap in technical terms.
Oscillators & Momentum
Momentum is mixed rather than cleanly bullish. The RSI at 61.7 is still in neutral territory, which suggests Tencent is not yet in a classic overbought condition on that measure. But the Stochastic %K at 91.5 and %D at 91.0 are both overbought, and that is a different message: the latest push has been fast enough that the stock may be vulnerable to a pause or a shallow pullback. In simple language, the market has been climbing quickly enough that short-term traders may start taking profits.
The MACD at 8.651 above its signal line at 4.980, with a histogram of 3.671, still confirms positive momentum. This is the key counterweight to the overbought Stochastic reading. MACD is essentially saying the trend is still supported by underlying strength, even if the pace has become a bit extended. That combination often appears when a stock is trending higher but needs consolidation before it can continue.
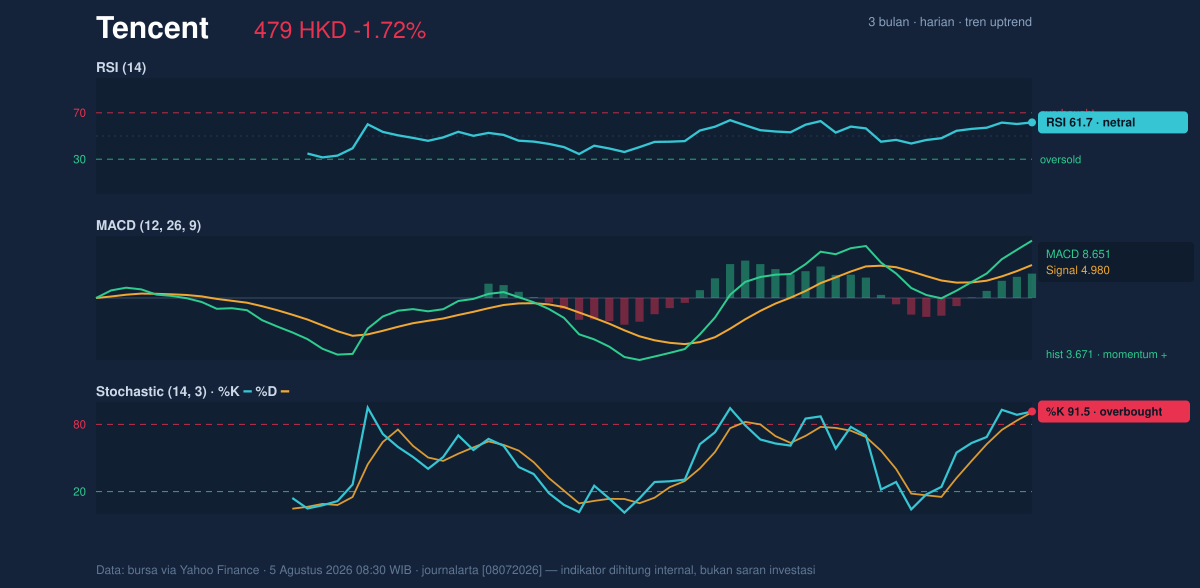
So the message from the oscillators is not “trend failed,” but rather “trend intact, yet stretched.”
Volatility & Volume
Volatility is elevated. The ATR(14) at 17.07, equal to 3.6% of price, indicates that daily swings remain wide enough to matter. That matters near resistance: a stock with higher volatility can overshoot levels briefly, but it can also reverse quickly if momentum fades. The Bollinger bands show price below the upper band at HKD 499.02 and above the middle band at HKD 465.46, with %B at 70%. That places the stock in the upper half of its volatility envelope without yet touching the top edge, which is consistent with a healthy uptrend that is not fully exhausted.
The Bollinger band width of 14.4% is described as normal, so the chart is not flashing a squeeze that would typically precede a sudden breakout. Instead, the setup suggests a more ordinary trend phase with room for movement, but not necessarily a dramatic expansion unless volume improves. And volume is the missing piece today: 25,662,478 shares traded versus a 20-hour average of 31,541,240, or 0.8x normal. That means the pullback happened on lighter participation, which is usually less damaging than a high-volume selloff. Still, the fact that volume did not expand on the move higher suggests conviction is not especially strong right now. OBV is rising, which helps the case that buyers have been accumulating over time, but the latest session did not bring the kind of heavy demand that would decisively clear resistance.
Key Levels & Scenarios
The market is now focused on a tight band between HKD 492.20 and HKD 497.80. A clean move through that zone would place Tencent above the recent ceiling and into fresh technical territory. If that fails, the stock still has first support at HKD 465.46, which is the Bollinger middle band and the SMA20, making it a natural pivot area. Below that, the next deeper cushion is HKD 434.60, where the recent range support sits.
The important signal is not just where the lines are, but how the stock behaves around them. A move above resistance on stronger volume would suggest the trend is regaining energy. A failure to hold the SMA20 would imply the current advance is losing momentum and needs more time to reset.
Technical Verdict: HOLD (wait & see)
HOLD (wait & see)
- MACD remains positive, so the broader trend is still supported.
- Stochastic is overbought, which warns the recent advance may need consolidation.
- Price is near resistance at HKD 492.20 and close to the 3-month high at HKD 497.80, so upside needs confirmation.
Verdict invalidated if price falls below HKD 465.46, where the trend would lose its short-term anchor.
- Ideal Entry Range: HKD 465.46 to HKD 479.20
- Exit Target (Target Price): HKD 492.20 to HKD 497.80
- Stop Loss protection: below HKD 434.60
For non-traders, this means Tencent still looks technically healthy, but the stock is close to a pause point rather than a clear breakout point.
“The trend is still alive, but the market has not yet earned a clean pass through the ceiling.”
Summary Data Tencent
| Last price | 479.20 HKD |
| Change 1 day / 5 days / 1 month | -1.72% / 2.74% / 0.08% |
| Trend / MA-cross | uptrend / none |
| SMA20 / SMA50 | 465.46 / 452.46 |
| RSI (14) / Stochastic %K | 61.7 / 91.5 |
| Bollinger %B / ATR | 70% / 17.07 |
| Support / Resistance 20 days | 434.60 / 492.20 |
| Data as of | 5 Agustus 2026 08:30 WIB |


