UOB Momentum Weakens: Stock Gains 0.76% (Agustus 7, 2026)
On Agustus 7, 2026: price 43.58 SGD, trend uptrend, RSI 55.4, support 42.47, resistance 44.95. technical analysis of uob stock. UOB Momentum Weakens — full…

United Overseas Bank rose to 43.58 SGD on SGX in early trading data dated 5 August 2026, up from the previous close of 43.25, but the move sits inside a market structure that is still trying to prove whether the latest push is a genuine continuation or just another pause within a broader uptrend. The share is holding above its short-term average, yet the momentum gauges are not fully aligned, which matters because a rising price without matching participation often means the advance is being carried by fewer buyers than the chart first suggests.
Trend & Price Action
The first signal is constructive: UOB remains in an uptrend, with the SMA20 at 43.50 and the price trading above the SMA20. That placement tells readers the stock is still being supported by near-term trend-followers, and the fact that the SMA20 is rising at 1.25% over 5 days shows the short-term bias is not flattening out. The broader structure is even more forgiving, because the SMA50 at 40.94 sits well below the market, which usually means the medium-term trend has already recovered and is not under immediate pressure.
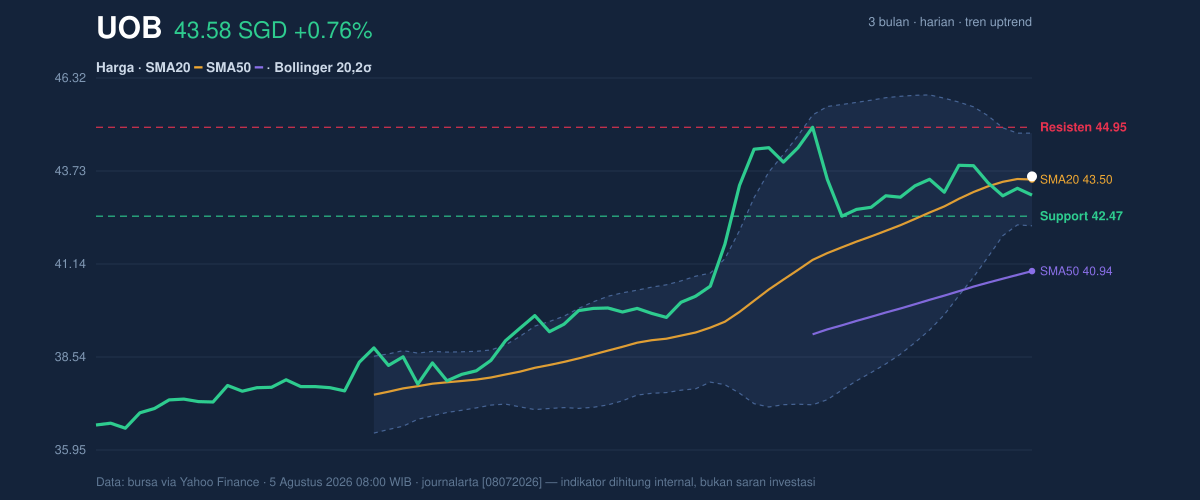
The price is also sitting in the upper half of its recent range, with the latest print at 45% of the 20-hour range between 42.47 support and 44.95 resistance. That location matters: it shows the stock is not stretched at the top of the band, but neither has it broken into a new leg higher. In plain terms, the market is still waiting for confirmation that buyers can absorb supply near resistance rather than simply defend the middle of the range. The 3-month high at 45.15 is close enough to act as a reference point for traders watching whether the stock can retest recent highs, while the 3-month low at 36.10 remains far enough away to underline how much of the earlier drawdown has already been repaired.
Oscillators & Momentum
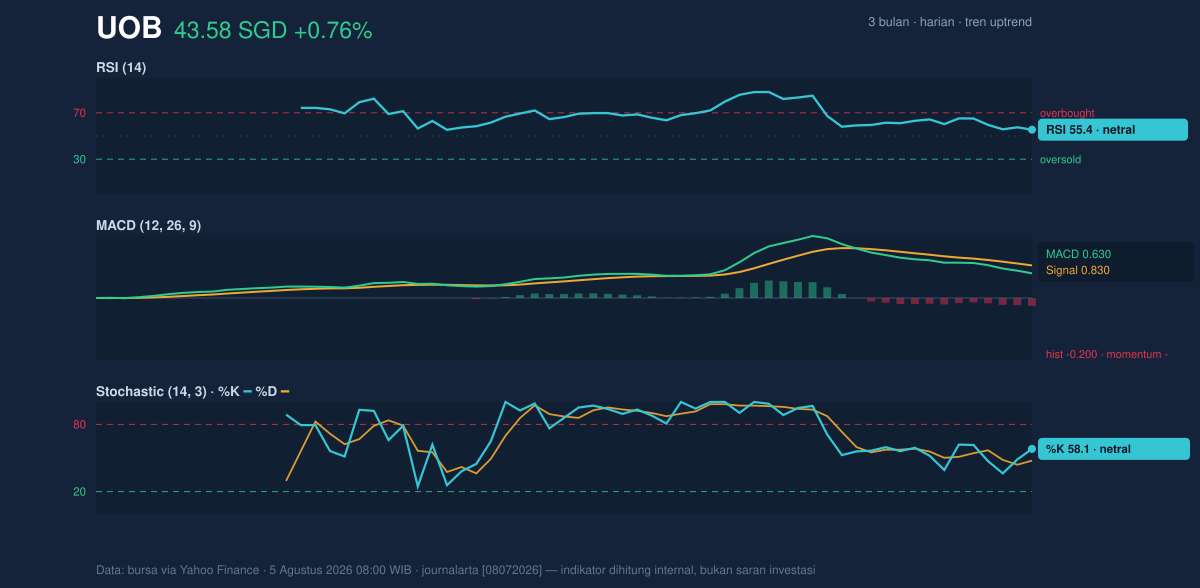
Momentum is more mixed than the trend. The RSI at 55.4 is neutral, which means the stock is neither overbought nor oversold and still has room to move either way. The Stochastic %K at 58.1 and %D at 47.7 also point to a middle-of-the-road reading, but with %K above %D, short-term price action is leaning firmer than the RSI alone would imply. That combination is important because it suggests the stock has not lost its upward footing, even if it is not showing the kind of strong momentum that typically drives a clean breakout.
The caution comes from the MACD at 0.630, which is below the signal line at 0.830, leaving a negative histogram of -0.200. For general readers, that means the trend is still positive on the chart, but the speed of that trend has slowed relative to recent history. When MACD turns softer while price remains above short averages, it often signals consolidation rather than immediate reversal — but it also warns that the next move depends on whether buyers can re-accelerate. In other words, the chart is not bearish, but it is not yet fully convincing.
Volatility & Volume
Volatility is moderate, with ATR(14) at 0.77, or 1.8% of price. ATR is a measure of how much the share tends to move in a typical session, so this reading suggests UOB is not in a panic phase and not in a dead zone either. That matters because the Bollinger Bands are also telling a similar story: the upper band at 44.79, middle band at 43.50, and lower band at 42.20 are compressed, with the band width at 5.9%. A squeeze in the bands often means the market is storing energy for a larger move, but the direction still needs confirmation from price and volume.
What is missing right now is participation. The latest volume of 2,357,500 is only 0.7x normal against the 20-hour average of 3,441,648, while OBV is falling. OBV, or on-balance volume, tracks whether trading flow is accumulating or distributing behind the price. A falling OBV during a modest price rise usually means the rally is not yet backed by broad conviction, and that makes resistance more important than usual. As shown in the chart, the stock is pressing toward the upper half of the Bollinger structure, but volume is not confirming urgency.
Key Levels & Scenarios
The immediate technical map is straightforward. 42.47 is the first line that matters on the downside, because it marks the 20-hour support and sits just above the lower Bollinger band at 42.20. If that floor gives way, the market would likely be signaling that the current squeeze is resolving lower rather than higher. On the upside, 44.95 is the key barrier, and it sits just above the upper Bollinger band at 44.79. A move through that zone would matter because it would show price is escaping the compression with enough force to challenge the 3-month high at 45.15.
The most useful read is conditional. If UOB can hold above the SMA20 at 43.50 and push through 44.95 resistance, the chart would begin to shift from consolidation to breakout attempt. If it fails to hold 42.47 support, the softer MACD and falling OBV would become more relevant, because they would suggest the recent bounce lacked depth. Right now the stock is still within an orderly uptrend, but the evidence says the next decisive move needs either stronger volume or a cleaner momentum turn.
Technical Verdict: HOLD (wait & see)
HOLD (wait & see)
- Price above SMA20 and SMA50 keeps the broader trend constructive.
- MACD below signal line and OBV falling show momentum and participation are not fully confirming the rise.
- Bollinger squeeze at 5.9% suggests a larger move may be coming, but direction is not yet proven.
Verdict invalidated if price falls below 42.47 support.
- Ideal entry range: 42.47 to 43.50
- Exit target: 44.95 to 45.15
- Stop loss protection: below 42.20
In plain English, the chart says UOB is still in decent shape, but it has not yet shown enough strength to prove the next leg higher.
Summary Data UOB
| Last price | 43.58 SGD |
| Change 1 day / 5 days / 1 month | 0.76% / -0.71% / 0.58% |
| Trend / MA-cross | uptrend / none |
| SMA20 / SMA50 | 43.50 / 40.94 |
| RSI (14) / Stochastic %K | 55.4 / 58.1 |
| Bollinger %B / ATR | 53% / 0.77 |
| Support / Resistance 20 days | 42.47 / 44.95 |
| Data as of | 5 Agustus 2026 08:00 WIB |

