AIA Stock Analysis: Gains 1.37%, Golden Cross Formed
On Agustus 10, 2026: price 74.15 HKD, trend sideways, RSI 41.1, support 72.40, resistance 79.65. technical analysis of aia stock. AIA Stock Analysis — full…

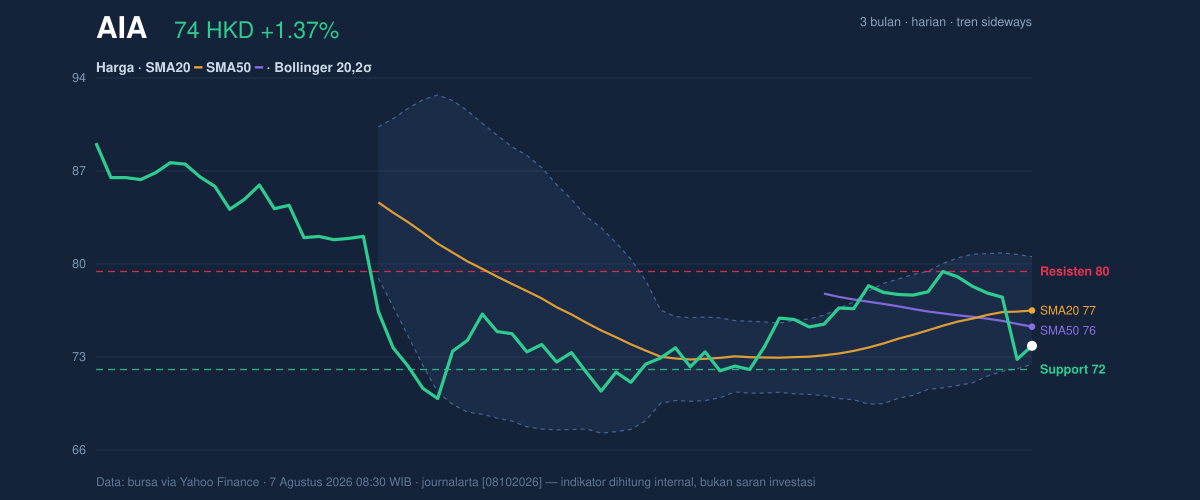
AIA Group fell to 74.15 HKD in Hong Kong trading, up 1.37% from the previous close of 73.15, but still sitting below its short-term trend markers. The move matters less as a one-day rebound than as a test of whether buyers can keep the stock above the lower end of its recent range. As shown in the chart, the share price remains beneath both its SMA20 at 76.76 and SMA50 at 75.56, which tells investors that the recovery is not yet strong enough to reclaim control from the recent pullback.
Trend & Price Action
The broader setup is best described as sideways, with the SMA20 slope at 1.08% over 5 days suggesting the short-term trend is still trying to turn up, but not decisively. That nuance matters. A rising moving average can signal that selling pressure is easing, yet the fact that price is still below the 20-day and 50-day averages means the market has not confirmed a clean trend reversal. The presence of a golden cross, where the SMA20 has moved above the SMA50, is constructive in principle, but it becomes more meaningful only when price holds above those lines rather than trading under them.
The stock is also trading at about 24% of its 20-day range, which places it closer to support than resistance. That positioning usually reflects caution, not strength. It suggests the market is still discounting the possibility of another leg lower unless buyers can lift the shares back into the middle of the range. The 3-month high of 89.95 and 3-month low of 69.05 frame the recent move as a rebound inside a wider band, not a breakout from a long consolidation.
Oscillators & Momentum
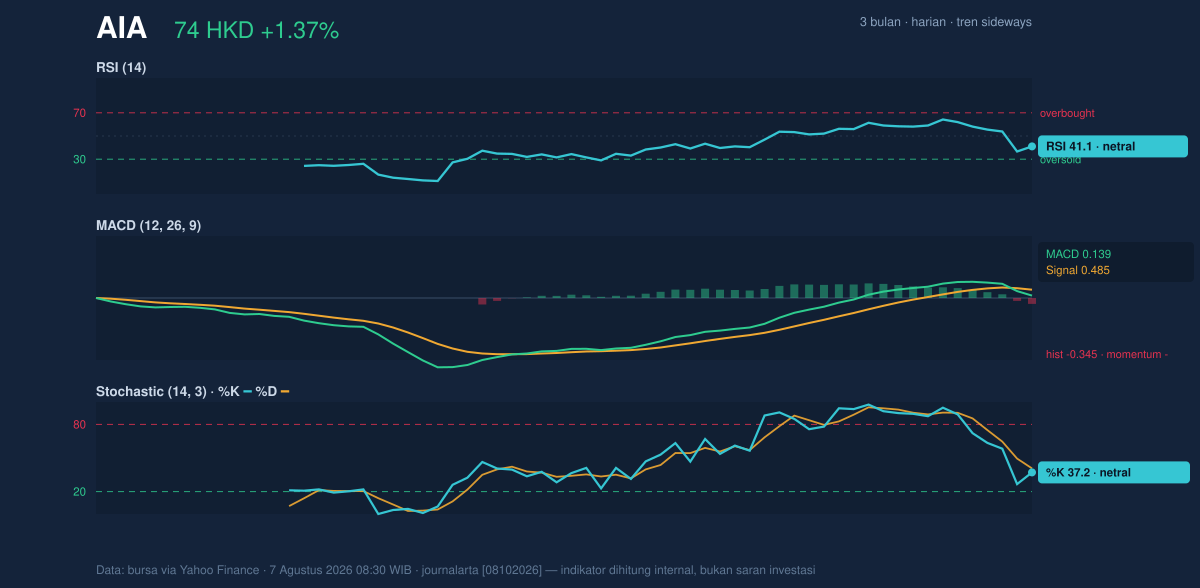
The momentum picture is mixed, and that is where the stock’s message becomes sharper. The RSI at 41.1 is neutral but leaning weak. RSI measures whether a stock has been pushed too far too fast; a reading around 41 says AIA is not washed out, but it also is not showing strong demand. The Stochastic %K at 37.2 and %D at 40.7 are also neutral, which means the share price is neither stretched nor in a strong impulse phase. In plain terms, the stock is drifting rather than accelerating.
The clearest warning comes from the MACD histogram at -0.345, with MACD at 0.139 below its signal line at 0.485. MACD is designed to show whether momentum is strengthening or fading. Here, it says the recent bounce has not yet generated enough force to overtake the prior downshift in momentum. That is important because a golden cross can look encouraging on the chart, but if MACD remains negative, the market is still asking for proof. As shown in the momentum chart, the indicators are aligned more with caution than with conviction.
Volatility & Volume
Bollinger Bands add another layer to the story. The %B at 17% shows the price is sitting in the lower portion of the band structure, near the lower band at 72.77 and well below the middle band at 76.76. That usually signals compressed sentiment rather than panic. The band width of 10.4% is normal, so this is not a squeeze that typically precedes a sharp breakout. Instead, it points to a market that is moving, but without unusual tension building underneath.
Volume complicates the picture in a useful way. Last session’s volume of 45,446,231 was about 1.7 times the 20-day average of 26,356,124. Heavy trading can confirm interest, but it does not automatically confirm direction. In this case, the fact that OBV is falling is the more telling signal. OBV, or on-balance volume, tracks whether volume is flowing into or out of the stock over time. A declining OBV suggests that the bigger money flow has not yet turned decisively supportive, even if one session’s turnover was strong. The result is a market with participation, but not yet clear accumulation.
ATR at 2.16, or 2.9% of price, indicates moderate volatility. That means the stock can move enough to matter without being exceptionally erratic. For traders reading the chart, this supports the idea that nearby levels are likely to be respected, at least until a fresh catalyst changes the balance.
Key Levels & Scenarios
The immediate technical map is straightforward. 72.40 is the key support from the 20-day range, while 79.65 is the nearest resistance. The lower Bollinger band at 72.77 reinforces that support zone, so the area around 72.40 to 72.77 is where the market is most likely to decide whether the rebound has staying power. If that area holds, the stock can keep trying to move back toward the 20-day average at 76.76 and then the resistance near 79.65. If it fails, the chart would likely shift back toward the lower end of the broader 3-month range.
The most important signal from the chart is not that AIA has turned bullish, but that it has not broken down either. The stock is in a fragile recovery phase, with a positive moving-average crossover but still-negative momentum underneath it. That combination usually means the burden of proof remains with buyers, and the next move will depend on whether price can reclaim the mid-band area rather than merely bounce from support.
Technical Verdict: HOLD (wait & see)
HOLD (wait & see)
- Reason 1: The golden cross is constructive, but price is still below SMA20 at 76.76 and SMA50 at 75.56, so the trend has not been fully reclaimed.
- Reason 2: MACD histogram -0.345 shows momentum remains negative even after the rebound.
- Reason 3: %B at 17% and price near the lower band suggest the stock is still trading in the weaker part of its range, while OBV is falling.
- Verdict invalidated if price breaks below 72.40, because that would put the stock under the key 20-day support and close to the lower Bollinger band at 72.77.
- Ideal Entry Range: 72.40 to 72.77
- Exit Target: 76.76 to 79.65
- Stop Loss protection: below 72.40
In plain English, the chart says AIA is trying to stabilize, but it has not yet proven that the rebound is strong enough to stand on its own.
Summary Data AIA
| Last price | 74.15 HKD |
| Change 1 day / 5 days / 1 month | 1.37% / -6.44% / 2.06% |
| Trend / MA-cross | sideways / golden |
| SMA20 / SMA50 | 76.76 / 75.56 |
| RSI (14) / Stochastic %K | 41.1 / 37.2 |
| Bollinger %B / ATR | 17% / 2.16 |
| Support / Resistance 20 days | 72.40 / 79.65 |
| Data as of | 7 Agustus 2026 08:30 WIB |


