BAC Testing Key Resistance: Stock Gains 0.27% (Agustus 10, 2026)
On Agustus 10, 2026: price 63.17 USD, trend uptrend, RSI 66.7, support 59.50, resistance 63.25. technical analysis of bac stock. BAC Testing Key Resistance —…

Bank of America is trading near the top of its recent range, with the stock pressing against resistance even as the broader trend still points higher. On 7 August 2026 at 20:30 WIB, BAC last changed hands at 63.17 USD, up 0.27% on the day and 1.97% over five days, according to Yahoo Finance data via the exchange feed. That matters for international readers because the stock is no longer trying to recover from weakness; it is now testing whether the current advance can extend beyond a crowded short-term ceiling.
Trend & Price Action
The larger setup remains constructive. BAC is trading above both its SMA20 at 61.77 and SMA50 at 58.39, which tells traders the shares are still in an established uptrend rather than a rebound inside a downtrend. The slope of the SMA20, up 1.46% over five days, is important because it shows the short-term average is still rising, not flattening out. That usually signals buyers have been willing to pay progressively higher prices.
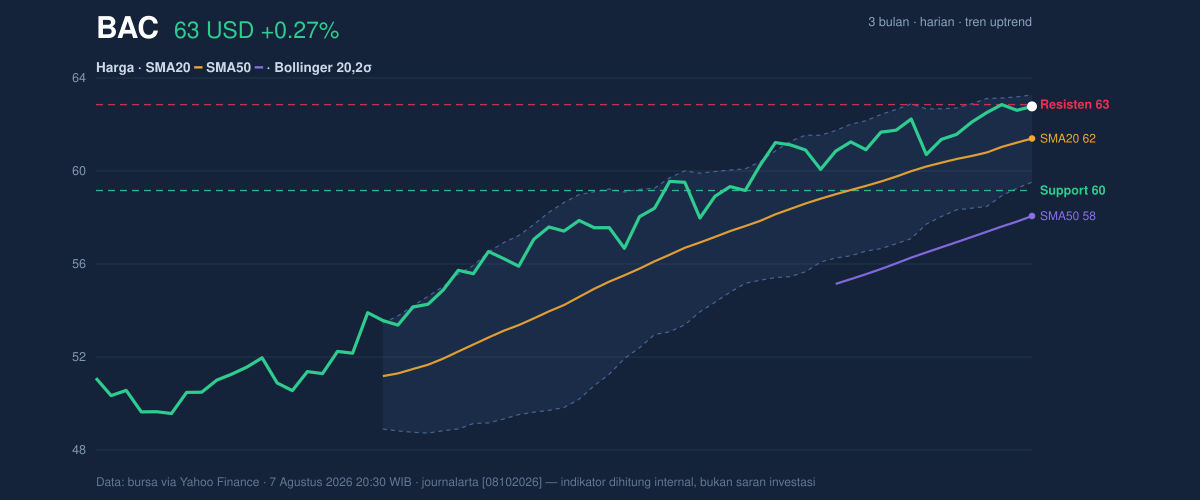
But the chart also shows the stock is not moving freely. With price at 63.17 and 20-hour resistance at 63.25, BAC is sitting at roughly 98% of its recent range. In plain language, the shares are near the upper edge of where they have been trading, so any further advance needs fresh demand rather than just momentum carry-over. The 3-month high at 63.97 is close enough to act as a magnet, but close enough to become a barrier too. The 3-month low at 49.30 is far below, which confirms the broader trend has already repaired significantly from earlier weakness.
Oscillators & Momentum
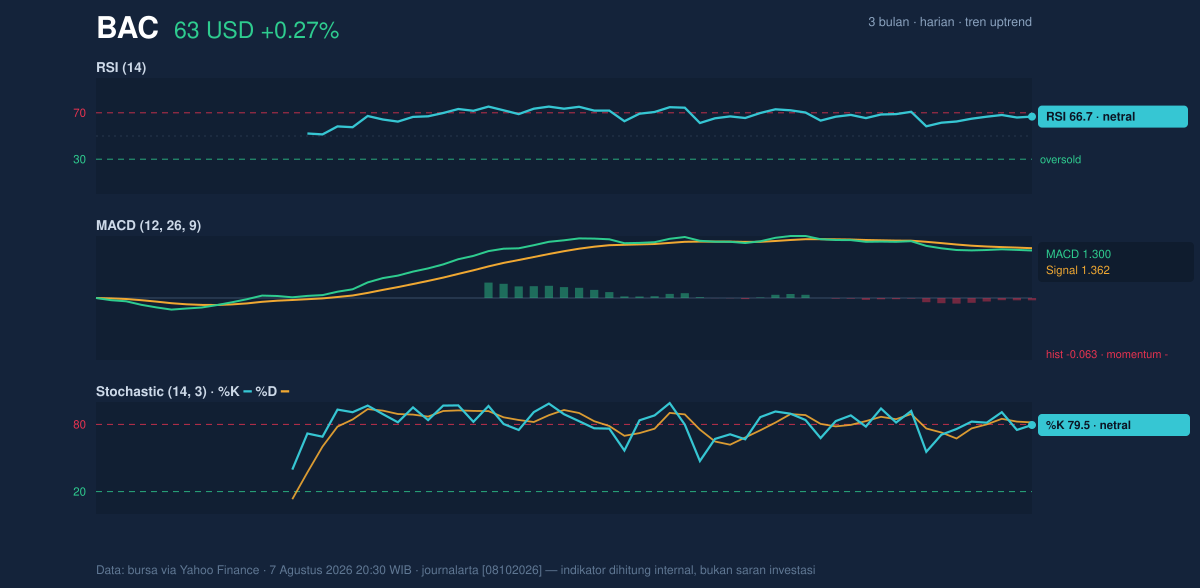
Momentum is less clean than the trend. The RSI at 66.7 is described as neutral in the data, but it sits near the upper end of the range where strength can start to look stretched. That does not mean an immediate reversal is likely; it means the market is no longer cheaply priced in momentum terms, so upside needs confirmation. The Stochastic %K at 79.5 and %D at 81.8 are also marked neutral, yet they are elevated enough to show the stock has been running hot recently. When both lines are near the top of the scale, price is often extended relative to its own recent path.
The more cautionary signal comes from MACD. The MACD at 1.300 remains above zero, which usually reflects an underlying uptrend, but it is below the signal line at 1.362, and the histogram at -0.063 is negative. That combination means upward momentum is still present, but it has softened enough for the faster trend measure to lose pace against the slower one. In practical terms, the trend has not broken; it is simply less energetic than the price chart alone might suggest.
Volatility & Volume
The Bollinger Bands add another layer of tension. BAC is trading just under the upper band at 63.67, with the middle band at 61.77 and the lower band at 59.86. The %B at 87% shows price is positioned high within the band structure, which often means the market is leaning toward the upper boundary. The more notable detail is the 6.2% band width, described as a squeeze. A squeeze matters because it often precedes a sharper move once price escapes the compression zone. That move can be upward if resistance gives way, or downward if buyers fail to hold the current level.
Volume does not yet confirm a breakout. The latest turnover was 22,609,800, below the 20-hour average of 33,024,555, or about 0.7x normal. That says the stock is rising without full participation from the market. In technical analysis, that can be a warning that the move is advancing on lighter conviction. Against that, OBV is rising, which means cumulative volume flow still favors buyers over time. So the picture is mixed: short-term volume is soft, but longer-term accumulation has not cracked.
Key Levels & Scenarios
The nearest battleground is clear. 63.25 is the immediate resistance, and 59.50 is the key 20-hour support. Because the stock is already near the top of its range, the market is effectively asking whether buyers can force a clean move above resistance or whether price will drift back toward the middle of the range around the 61.77 Bollinger midline and SMA20.
If BAC clears 63.25 decisively, the next reference is the 63.67 upper Bollinger band and then the 63.97 3-month high. That would suggest the squeeze is resolving upward and that the trend is being renewed rather than merely extended. If it fails to hold above 59.50, the technical tone would weaken quickly because the stock would be slipping back under the recent support shelf and closer to the band midline.
Technical Verdict: HOLD (wait & see)
HOLD (wait & see) is the cleanest reading from the chart because the trend is positive, but momentum and volume are not strong enough to confirm a fresh breakout.
- Reason 1: Price remains above the SMA20 at 61.77 and SMA50 at 58.39, which supports the broader uptrend.
- Reason 2: The MACD is negative versus its signal line and the histogram is below zero, showing momentum has cooled.
- Reason 3: The stock is pressing 63.25 resistance with volume at 0.7x normal, so the move lacks strong confirmation.
- Verdict invalidated if price breaks below 59.50, because that would weaken the current range structure and put the stock back under its nearest support.
- Ideal Entry Range: 61.77 to 63.25
- Exit Target: 63.67 to 63.97
- Stop Loss protection: 59.50
For non-traders, this means BAC still looks healthy, but the chart is asking for proof before the next leg higher can be trusted, and the next clear test is whether it can finish a session above 63.25.
Summary Data BAC
| Last price | 63.17 USD |
| Change 1 day / 5 days / 1 month | 0.27% / 1.97% / 5.87% |
| Trend / MA-cross | uptrend / none |
| SMA20 / SMA50 | 61.77 / 58.39 |
| RSI (14) / Stochastic %K | 66.7 / 79.5 |
| Bollinger %B / ATR | 87% / 1.01 |
| Support / Resistance 20 days | 59.50 / 63.25 |
| Data as of | 7 Agustus 2026 20:30 WIB |

