CRM Golden Cross Formed: Stock Gains 3.20% (Agustus 10, 2026)
On Agustus 10, 2026: price 192.74 USD, trend uptrend, RSI 62.5, support 156.93, resistance 192.98. technical analysis of crm stock. CRM Golden Cross Formed —…

Salesforce (CRM) rose to 192.74 USD on the NYSE, extending a strong near-term advance as the stock pushed back toward the upper edge of its Bollinger band, according to market data from Yahoo Finance. The move matters because it is not just a one-day bounce: the shares are now trading above both short- and medium-term averages, while momentum signals are beginning to show some strain after a fast run.
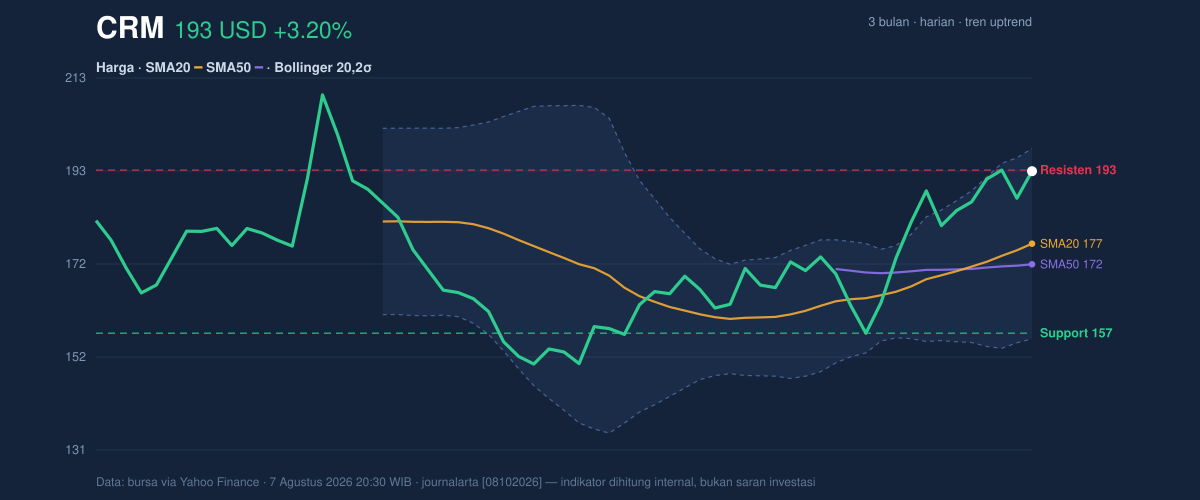
The stock gained 3.20% in the latest session, added 4.74% over five days and is up 18.01% in one month. That sequence shows more than a simple relief rally. It suggests buyers have been willing to step in repeatedly, and the chart has shifted into an uptrend with the SMA20 at 176.72 sitting above the SMA50 at 172.15. In plain terms, the shorter average price is now above the longer one, a classic sign that recent price action has turned stronger than the broader trend that preceded it. The golden cross — when the 20-day average moves above the 50-day average — reinforces that message.
Trend & Price Action
As shown in the chart, CRM is trading above the SMA20 and has room only until the upper Bollinger band at 197.75 before it reaches the top of its recent volatility envelope. The stock is also sitting near 99% of its 20-hour range, with 192.98 marked as resistance and 156.93 as support. That positioning tells readers the market has already priced in a lot of the recent bullishness; there is little air left between the current price and the nearest resistance.
The broader three-month range adds context. CRM has already moved well above the 146.32 low, but it remains below the 211.34 high. So while the trend is constructive, the stock is still working through a recovery rather than breaking into uncharted territory. The key question is whether momentum can keep pace with price after such a sharp climb.
Oscillators & Momentum
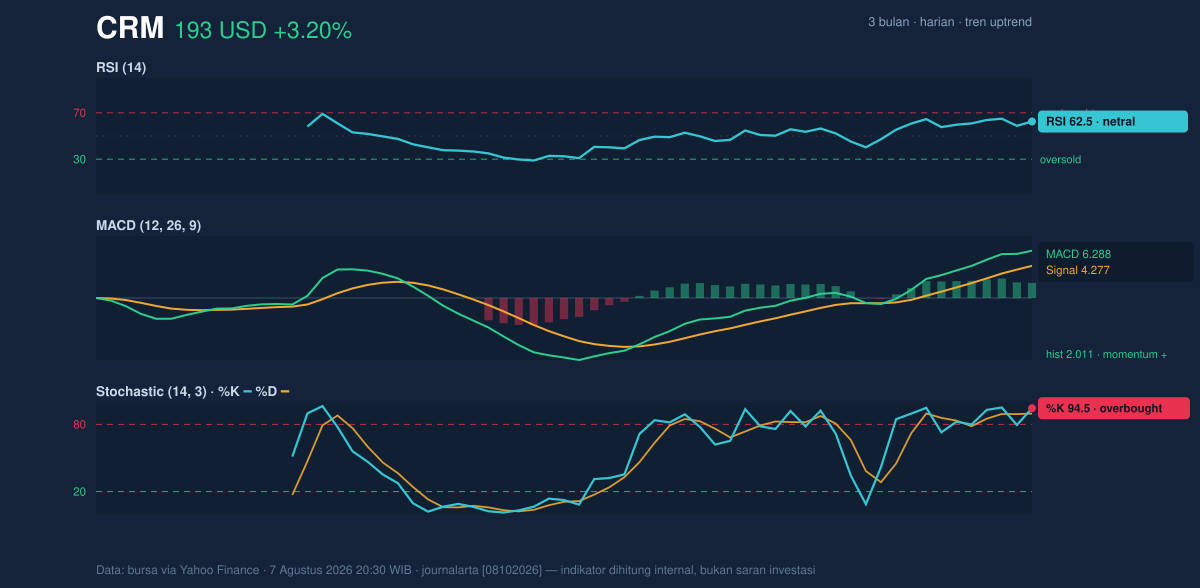
The momentum picture is mixed, and that is important. The RSI at 62.5 is still in neutral territory, which means the stock is not yet in a classic overbought condition on that measure. But the Stochastic reading of 94.5/%D 89.7 is clearly overbought, showing that CRM has been closing near the top of its recent range for several sessions. That does not automatically mean a reversal is imminent; rather, it means the rally is becoming stretched and more vulnerable to pauses or pullbacks.
The MACD at 6.288, above its signal line at 4.277, keeps the trend confirmation intact. The positive histogram of 2.011 shows the gap between momentum and its trigger remains supportive. In practical terms, this says upward force is still present even if shorter-term oscillators are flashing caution. The charts therefore show a market that is still trending up, but with enough extension to make fresh gains harder to sustain without consolidation.
Volatility & Volume
Volatility is elevated. The ATR at 9.01, equal to 4.7% of price, means daily swings are relatively wide, so moves can accelerate quickly in either direction. The Bollinger band width of 23.8% and the fact that the bands are expanding point to a market that is actively repricing CRM rather than drifting sideways. Expansion in the bands often follows stronger directional moves, but it also raises the odds of sharper retracements if buyers pause.
Volume adds a subtle note of caution. The latest trading volume of 11,390,400 was below the 12,814,550 20-day average, or about 0.9x normal. That means the latest push higher was not backed by unusually heavy participation. Still, OBV is rising, which indicates the broader flow of money has continued to lean in the same direction even if the latest session did not feature a volume surge. In other words, the trend has support, but not the kind of emphatic volume spike that usually marks a decisive breakout.
Key Levels & Scenarios
The near-term map is straightforward. 192.98 is the immediate resistance to watch, and the upper Bollinger band at 197.75 is the next technical ceiling if price can keep pressing higher. On the downside, 176.72 — the SMA20 and Bollinger middle band — is the first important reference, followed by 172.15 at the SMA50. Below that, 156.93 is the 20-hour support that would matter if the current advance starts to unwind.
If CRM clears 192.98 and holds above the upper band area, the chart would suggest continuation of the uptrend. If it fails to hold 176.72, the market would be signaling that the recent breakout has lost some of its force and could revert toward the deeper support zone. The fact that price is already near the top of the short-term range means the next move is likely to be more informative than the last one.
Technical Verdict: HOLD (wait & see)
HOLD (wait & see)
- MACD remains positive, showing the trend is still supported.
- Price is above SMA20 and SMA50, and the golden cross confirms the medium-term structure has improved.
- Stochastic is overbought and price is near 192.98 resistance, so upside continuation may need a pause or fresh volume.
Verdict invalidated if price falls below 176.72.
- Ideal Entry Range: 176.72 to 172.15
- Exit Target: 192.98 to 197.75
- Stop Loss protection: 156.93
For non-traders, this means the stock still looks technically healthy, but it is close enough to resistance and overbought signals that patience matters more than chasing the current move.
The 3-month high for CRM is 211.34 USD.
Summary Data CRM
| Last price | 192.74 USD |
| Change 1 day / 5 days / 1 month | 3.20% / 4.74% / 18.01% |
| Trend / MA-cross | uptrend / golden |
| SMA20 / SMA50 | 176.72 / 172.15 |
| RSI (14) / Stochastic %K | 62.5 / 94.5 |
| Bollinger %B / ATR | 88% / 9.01 |
| Support / Resistance 20 days | 156.93 / 192.98 |
| Data as of | 7 Agustus 2026 20:30 WIB |

