DBS Stock Gains 1.66% Today, RSI Overbought
On Agustus 10, 2026: price 76.33 SGD, trend uptrend, RSI 73.5, support 70.79, resistance 76.33. technical analysis of dbs stock. DBS Stock Gains — full details…

DBS Group’s shares ended at 76.33 SGD, up 1.66% on the day and now sitting at the very top of their recent trading band, after a month-long rise of 8.35%, according to exchange-linked market data. That matters because the move is not just a one-day pop: the stock is trading above its short- and medium-term averages, but the latest momentum readings are starting to look stretched. In plain terms, DBS is still in an uptrend — yet the pace of the advance is now fast enough to raise the risk of pause or pullback.
Trend & Price Action
The price structure remains constructive. DBS is above its SMA20 at 73.57 and well above its SMA50 at 68.72, which tells the market that buyers have been willing to pay progressively higher prices over both the short and intermediate term. The uptrend is reinforced by the SMA20 slope, which has risen 1.98% over five days. That slope is important: it signals that the trend is not merely drifting upward, but accelerating enough to keep dip-buyers engaged.
Still, the stock is now pressing against the upper edge of its range. The 3-month high is 76.33, the same as the last price, and the 20-hour resistance is 76.33. In other words, DBS has reached a ceiling where recent sellers have previously emerged, and the market is now testing whether there is enough demand to force a clean break higher.
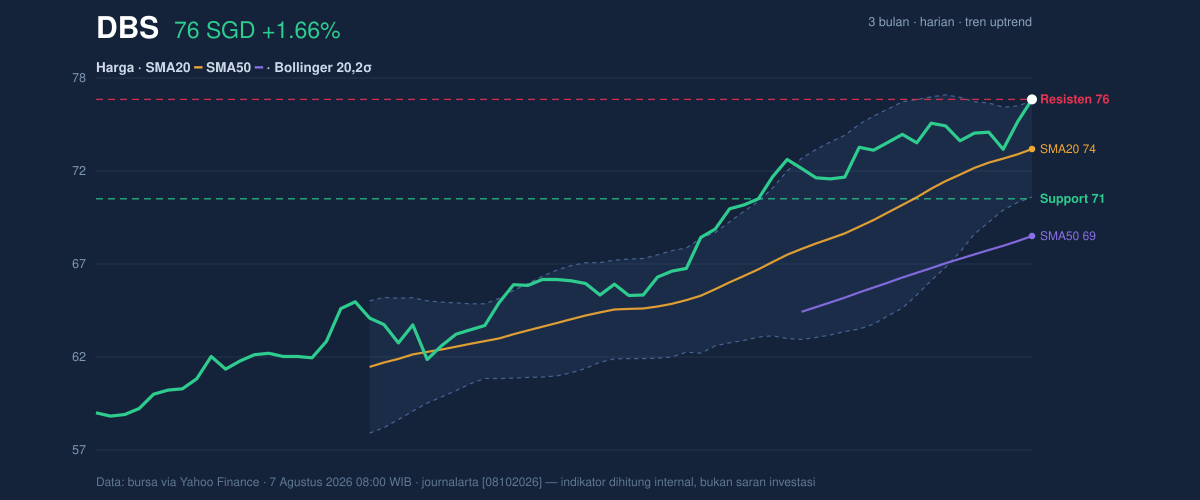
A short, sharp point: price is strong, but it is also at the edge.
The Bollinger setup adds nuance. With the upper band at 76.24, the share price has pushed to %B 102%, meaning it is trading slightly beyond the upper envelope of its recent volatility range. That often signals momentum strength, but it can also mean the move is extended in the short run. The 7.3% band width suggests a squeeze — a compressed volatility phase that often precedes a larger move. When price is already at the top of a squeeze, the next move can be sharp either way.
Oscillators & Momentum
The momentum indicators are less comfortable than the trend. The RSI(14) at 73.5 and Stochastic %K at 100.0 with %D at 81.3 both point to an overbought condition. For general readers, that does not mean the stock must fall immediately; it means the recent rise has been fast enough that the market may be vulnerable to profit-taking or a brief reset.
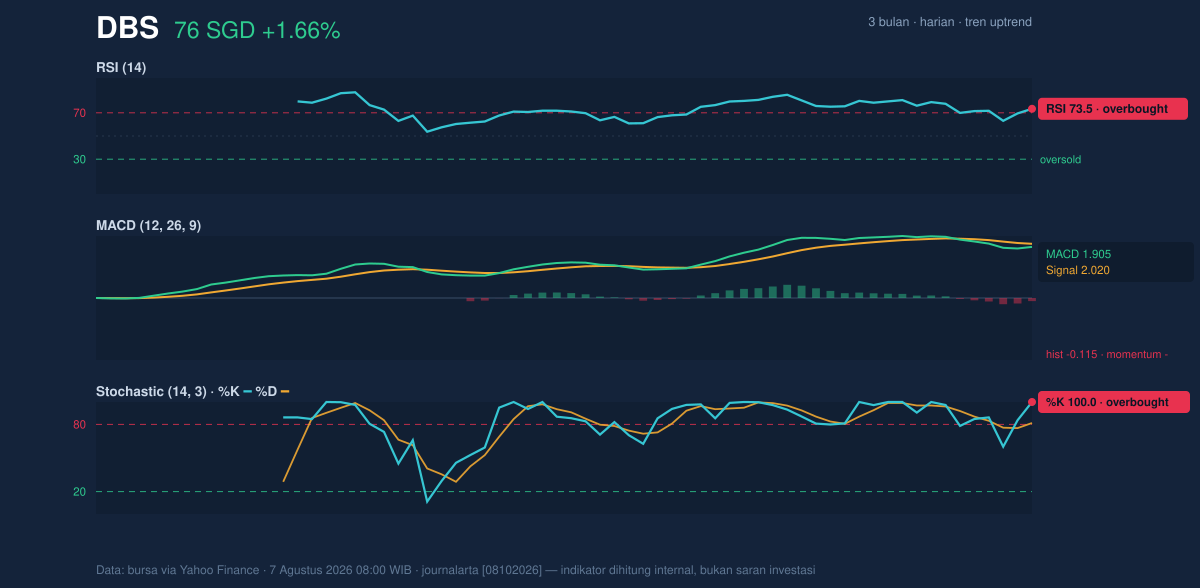
The more telling signal is the MACD histogram at -0.115, with the MACD line at 1.905 below the signal line at 2.020. That combination means the broader trend is still upward, but the rate of ascent has started to slow. This is a classic divergence pattern: price is pushing into highs while momentum is not confirming with equal strength. In technical terms, the trend is intact, but the engine is losing a little pull.
That matters because overbought readings are strongest when they appear alongside weakening MACD momentum. It suggests the rally may be mature rather than freshly ignited.
Volatility & Volume
Volume offers partial confirmation. The latest turnover of 6,786,400 shares is about 1.4× the 20-day average of 4,817,997, and OBV is rising. That combination tells us the advance is backed by participation, not just thin trading. Rising OBV is especially useful because it implies that buying pressure has been persistent across sessions, not merely concentrated in one headline-driven day.
At the same time, the ATR(14) of 1.20, equal to 1.6% of price, shows volatility is moderate rather than explosive. So while the Bollinger squeeze hints at a possible breakout, the ATR says the stock is not behaving like a highly erratic name. The setup is more like a compressed spring than a wild swing.
There is a tension here: strong participation, but stretched momentum.
Key Levels & Scenarios
The immediate map is clear. The 20-hour support at 70.79 is the first line that would matter if the stock starts to cool. Below that, the SMA20 at 73.57 becomes the more important trend reference, because a move back under it would suggest the recent breakout attempt has failed to hold. On the upside, the key barrier is the 76.33 resistance/3-month high, now being tested directly.
If DBS can hold above 76.33, the chart would shift from a range test to a potential continuation breakout. If it cannot, the overbought RSI and negative MACD histogram make a pullback toward the SMA20 at 73.57 a realistic near-term response. That is the message of the chart: strength is present, but so is exhaustion.
Technical Verdict: HOLD (wait & see)
HOLD (wait & see) — the trend is positive, but the stock is stretched at resistance and momentum is not fully confirming.
Reasons:
- Price is above SMA20 and SMA50, confirming the broader uptrend.
- RSI 73.5 and Stochastic 100.0/81.3 show the move is overbought.
- MACD histogram -0.115 signals fading upward momentum even as price tests highs.
Verdict invalidated if price breaks below 70.79, because that would undercut the nearest support and weaken the current trend structure.
- Ideal Entry Range: around 73.57 to 70.79, where the chart would be closer to support rather than at resistance.
- Exit Target: 76.33 initially; a sustained move above that level would indicate the breakout is holding.
- Stop Loss protection: below 70.79, since that is the nearest support from the data.
For non-traders, this means DBS still looks strong, but the share price is now at a point where the market is asking a simple question: can buyers keep pushing, or is the rally due for a breather? “The next move will tell us whether this is a breakout or just a pause.”
Summary Data DBS
| Last price | 76.33 SGD |
| Change 1 day / 5 days / 1 month | 1.66% / 3.12% / 8.35% |
| Trend / MA-cross | uptrend / none |
| SMA20 / SMA50 | 73.57 / 68.72 |
| RSI (14) / Stochastic %K | 73.5 / 100.0 |
| Bollinger %B / ATR | 102% / 1.20 |
| Support / Resistance 20 days | 70.79 / 76.33 |
| Data as of | 7 Agustus 2026 08:00 WIB |

