Momentum Gains, QCOM Stock Gains 4.66% Today
On Agustus 10, 2026: price 167.86 USD, trend sideways, RSI 47.2, support 147.61, resistance 183.98. technical analysis of qcom stock. Momentum Gains — full…

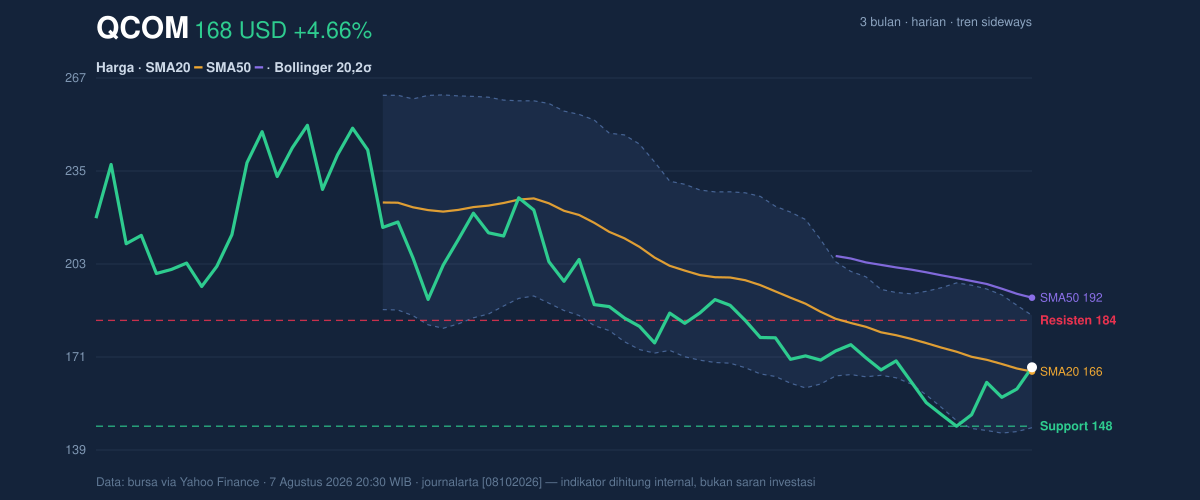
Qualcomm Inc. rose to US$167.86 on Nasdaq, up 4.66% from the prior close of US$160.39, but the move still sits inside a broader sideways pattern, with the stock trading just above its short-term average while remaining far below its longer-term trend line. The chart, as shown in the price action view, suggests a market trying to stabilize after a month of weakness rather than one that has fully reversed course.
Trend & Price Action
The most important signal here is that Qualcomm is holding above its SMA20 at US$166.39 but remains well below the SMA50 at US$191.78. That matters because the 20-day average reflects the short-term trading rhythm, while the 50-day line reflects the medium-term trend. Being above the shorter average is a modest sign of recovery; being below the longer one says the larger trend is still under pressure. The sideways trend label fits that picture: the stock is not breaking down decisively, but it is also not yet reclaiming the sort of momentum that would signal a clean trend change.
The price is also positioned in the middle of its recent band, at about 56% of the 20-hour range, with support at US$147.61 and resistance at US$183.98. That places the current move in the middle ground, not at an extreme. In plain terms, the market is testing whether the recent bounce has enough force to move toward the upper end of the range, rather than simply drifting back toward the floor.
Short-term strength is real, but it is not yet decisive.
Oscillators & Momentum
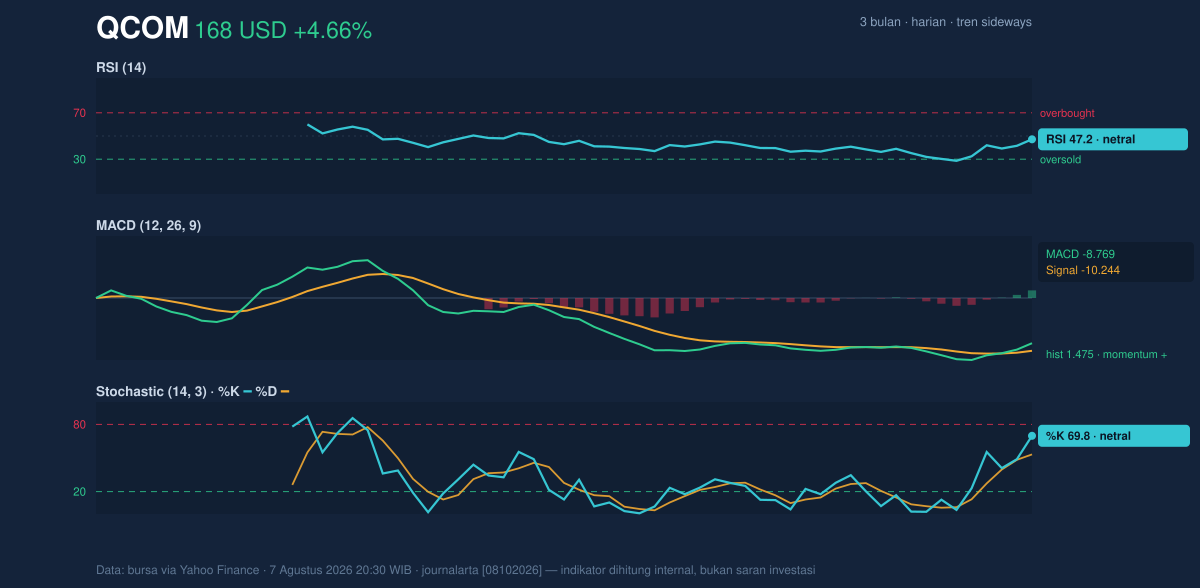
Momentum indicators are mixed, and that is the key nuance. The RSI at 47.2 is neutral, meaning the stock is neither overbought nor oversold. That is generally consistent with a market that is still searching for direction. The Stochastic %K at 69.8 and %D at 53.2 lean firmer than RSI, suggesting recent buying pressure is stronger than the broader momentum gauge implies, but not yet stretched enough to imply an exhausted rally.
The more constructive signal comes from the MACD at -8.769, which remains below zero, but sits above the signal line at -10.244, leaving a positive histogram of 1.475. For general readers, that means the stock’s downside momentum is easing and the shorter-term trend is improving relative to the longer one. It is not a bullish breakout signal by itself, but it does show that selling pressure has weakened enough for a rebound attempt to develop.
That is the difference between “less bad” and “fully positive.”
Volatility & Volume
Volatility is elevated. The Bollinger Band width of 23.2% shows the bands are widening, which usually means the market is expecting larger price swings rather than quiet consolidation. The ATR at US$7.72, equal to 4.6% of price, reinforces that message: daily movement is likely to remain sizable. The current price sits near the middle of the Bollinger structure, with %B at 54%, indicating neither band is being pressed. In other words, the stock is not at a volatility extreme; it is in the middle of a potentially active range.
Volume, however, tempers the optimism. The latest turnover of 9,717,700 shares is only 0.7x the 20-session average of 13,101,445, and OBV is down. That combination matters because rising prices are usually more convincing when more shares are changing hands. Here, the rebound is happening on lighter participation, which weakens the signal that institutional money is broadly behind the move.
The bounce has legs, but the crowd is not fully on board.
Key Levels & Scenarios
The nearby technical map is clear. US$166.39 is the first important pivot because it is the SMA20 and sits almost exactly under the current price. Holding above it would keep the short-term recovery intact. Above that, US$183.98 is the first major resistance from the 20-hour range, and then the US$185.70 upper Bollinger band becomes the next technical ceiling. A move through that zone would suggest the rebound is broadening, not just bouncing.
On the downside, US$147.61 is the first support to watch, closely followed by the US$147.08 lower Bollinger band. That area is important because it marks where the market has previously found a floor while also aligning with a volatility boundary. A failure there would imply the recent recovery has run out of steam and that the stock may revisit the lower end of its broader 3-month range, which runs from US$142.89 to US$259.92.
Technical Verdict: HOLD (wait & see)
HOLD (wait & see) fits the current setup because the chart shows recovery without confirmation.
- RSI at 47.2 is neutral, so momentum is not strong enough to call the move decisive.
- MACD histogram at 1.475 is positive, but the MACD line is still below zero, which points to improving but unfinished trend repair.
- Volume at 0.7x normal and OBV down suggest the rally lacks broad participation.
- The verdict is invalidated if price breaks below US$147.61, which would expose the lower Bollinger band at US$147.08.
- Ideal Entry Range: US$166.39 to US$167.86, where price is testing the SMA20 and current pivot area.
- Exit Target: US$183.98 to US$185.70, aligned with resistance and the upper Bollinger band.
- Stop Loss protection: below US$147.61, with the lower Bollinger band at US$147.08 as the technical warning zone.
For non-traders, this means the stock is improving, but it has not yet proven that the recovery is strong enough to trust without caution.
The 3-month high is US$259.92.
Summary Data QCOM
| Last price | 167.86 USD |
| Change 1 day / 5 days / 1 month | 4.66% / 13.72% / -11.26% |
| Trend / MA-cross | sideways / none |
| SMA20 / SMA50 | 166.39 / 191.78 |
| RSI (14) / Stochastic %K | 47.2 / 69.8 |
| Bollinger %B / ATR | 54% / 7.72 |
| Support / Resistance 20 days | 147.61 / 183.98 |
| Data as of | 7 Agustus 2026 20:30 WIB |

