Momentum Weakens, UOB Stock Drops 0.64% Today
On Agustus 10, 2026: price 43.30 SGD, trend sideways, RSI 56.6, support 42.47, resistance 44.95. technical analysis of uob stock. Momentum Weakens — full…

UOB slipped to SGD 43.30 on SGX, down from SGD 43.58 in the previous close, as the stock stayed inside a broad sideways range while trading just below its short-term average. The move matters because it shows the shares are not breaking down decisively, but neither are they reclaiming enough ground to suggest fresh upside momentum; instead, the chart is still waiting for a cleaner signal.
Trend & Price Action
As shown in the chart, UOB is still in a sideways trend, with the SMA20 at SGD 43.40 and the SMA50 at SGD 41.17. The price sitting below the SMA20 but above the longer average tells a simple story: short-term sentiment has softened, yet the medium-term structure has not broken. There is no fresh MA-cross, which means the moving averages are not delivering a new trend signal; in plain English, the market has not chosen a direction.
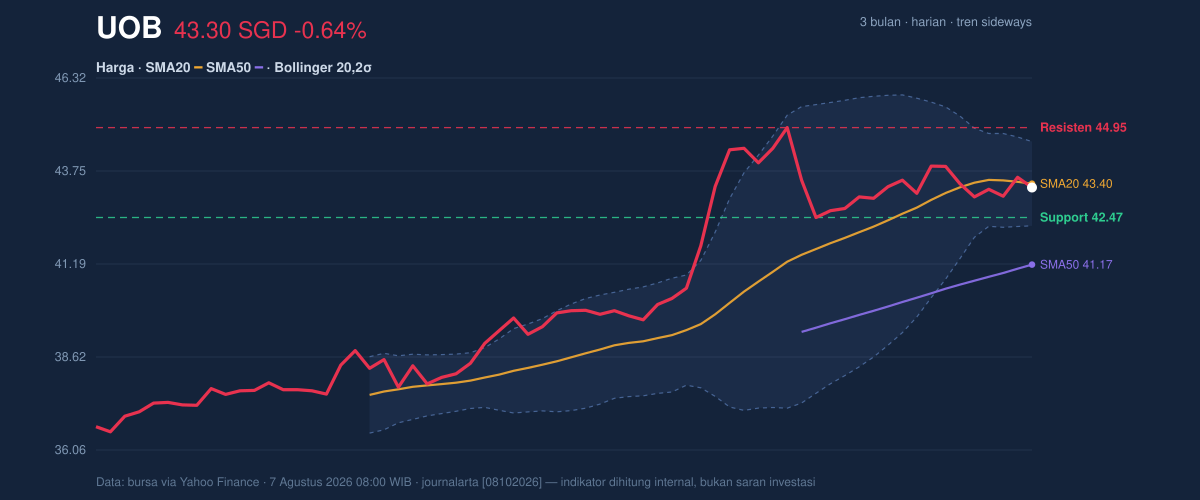
That positioning also fits the range data. UOB is trading at about 33% of the 20-day range, with support at SGD 42.47 and resistance at SGD 44.95. The stock is closer to the lower half of the band, but not at the floor, so the chart is more “compressed” than broken. The broader 3-month high of SGD 45.15 and 3-month low of SGD 36.10 show how much of the earlier rebound has already been absorbed, and why the current level looks like a consolidation zone rather than a breakout base.
Oscillators & Momentum
Momentum readings are mostly neutral, but the message under the surface is slightly softer than the headline suggests. The RSI(14) at 56.6 is neither overbought nor oversold, which means the stock still has room to move either way without being technically stretched. The Stochastic %K at 61.9 and %D at 67.0 also sit in neutral territory, pointing to a market that is not yet showing an exhaustion signal or a strong acceleration signal.
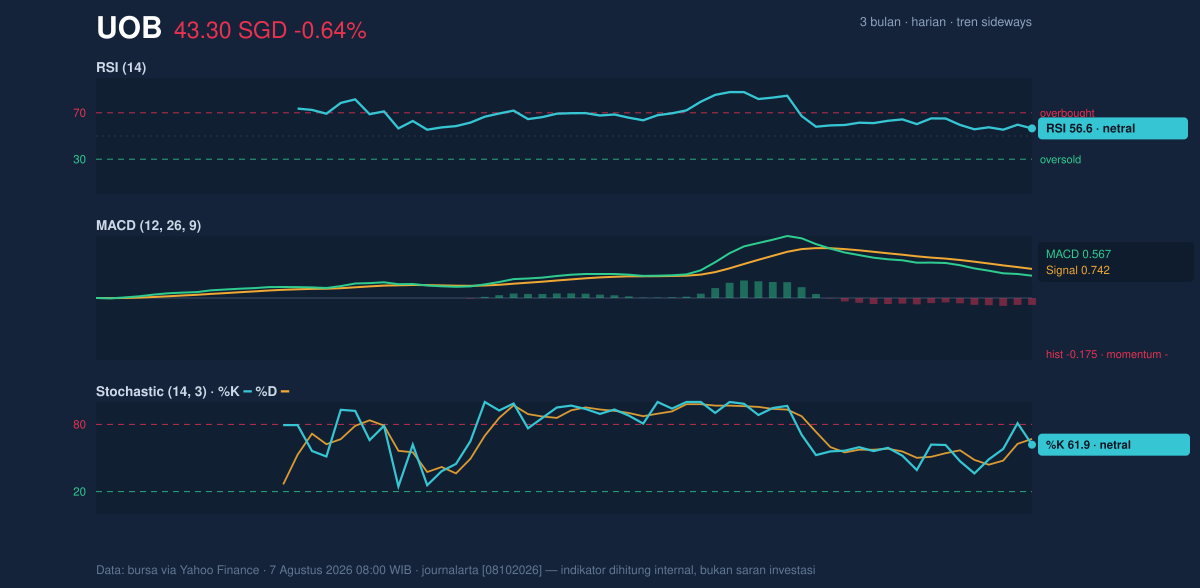
The more important detail is the MACD histogram at -0.175, with the MACD line at 0.567 below the signal line at 0.742. That negative histogram means recent price momentum is weaker than the slower trend measure, a classic sign that the stock is losing some short-term traction even while the broader trend remains intact. It is not a bearish collapse; it is a warning that buyers are not pressing hard enough yet to force a clean upside move.
Volatility & Volume
Volatility is moderate, not wild. The ATR(14) at 0.73, equal to 1.7% of price, suggests that normal daily swings are still manageable, but large enough for the stock to test nearby levels without much warning. More interesting is the Bollinger setup: the upper band at SGD 44.56, middle band at SGD 43.40, and lower band at SGD 42.24 are wrapped inside a 5.3% band width, which is a squeeze. A squeeze usually means volatility has been compressed and a larger move may follow; it does not say direction, only that the current quiet phase may not last.
The volume profile adds a mixed signal. Last session volume reached 6,542,300, about 1.8× the 20-day average of 3,543,178. That is a meaningful burst of participation, so the move was not caused by thin trading. Yet OBV is down, which means the volume trend has not been accumulating in a way that confirms sustained buying pressure. In other words, traders are active, but the balance of that activity still leans cautious.
Key Levels & Scenarios
The chart’s most important lines are straightforward. SGD 42.47 is the first support to watch, while SGD 44.95 is the nearest resistance. The Bollinger framework adds another layer: SGD 42.24 is the lower band and SGD 44.56 is the upper band, so the stock is currently sitting between the middle and lower portions of its short-term envelope.
If UOB holds SGD 42.47 and starts pushing back through SGD 43.40, the chart would look healthier because price would be reclaiming the Bollinger midline and the SMA20. If it then extends toward SGD 44.56 and SGD 44.95, that would indicate the squeeze is resolving upward. If instead the stock loses SGD 42.47 and slips toward SGD 42.24, the market would be signaling that the current range is giving way on the downside.
Technical Verdict: HOLD (wait & see)
HOLD (wait & see) is the clearest read from the current setup because the chart is balanced between a compressed volatility pattern and a momentum profile that has not turned convincingly positive.
- Strongest reasons:
- Price is below the SMA20, which keeps short-term pressure in place.
- MACD histogram is negative, showing momentum is weaker than the trend line.
- Bollinger bands are squeezing, which often precedes a move but does not confirm direction yet.
- Invalidation condition: this verdict is invalidated if price breaks below SGD 42.47, because that would weaken the nearest support and raise the odds of a deeper test toward the lower band.
- Ideal Entry Range: SGD 42.47 to SGD 43.40
- Exit Target: SGD 44.56 to SGD 44.95
- Stop Loss protection: below SGD 42.24
For non-traders, this means UOB looks like a stock waiting for the market to decide whether the next move is a rebound or a fade, and the next test is whether it can hold SGD 42.47 while closing back above SGD 43.40.
Summary Data UOB
| Last price | 43.30 SGD |
| Change 1 day / 5 days / 1 month | -0.64% / -0.23% / -2.43% |
| Trend / MA-cross | sideways / none |
| SMA20 / SMA50 | 43.40 / 41.17 |
| RSI (14) / Stochastic %K | 56.6 / 61.9 |
| Bollinger %B / ATR | 46% / 0.73 |
| Support / Resistance 20 days | 42.47 / 44.95 |
| Data as of | 7 Agustus 2026 08:00 WIB |


