NVDA Stock Gains 2.27% Today, Golden Cross Formed
On Agustus 10, 2026: price 223.96 USD, trend uptrend, RSI 64.3, support 190.01, resistance 223.96. technical analysis of nvda stock. NVDA Stock Gains — full…

Nvidia rose to 223.96 USD on Nasdaq, up 2.27% on the day, with the share price pressing into the top of its recent trading range. That move matters because it came with a golden cross already in place, but also with momentum gauges flashing a short-term overbought warning.
Trend & Price Action
The broader structure remains constructive. As shown in the chart, Nvidia is trading above its 20-day moving average at 206.82 and also above the 50-day moving average at 206.07, which keeps the trend aligned to the upside rather than drifting sideways or weakening. The SMA20 is rising at 1.73% over 5 days, a useful sign that recent gains are not just a one-day spike but part of a sustained push.
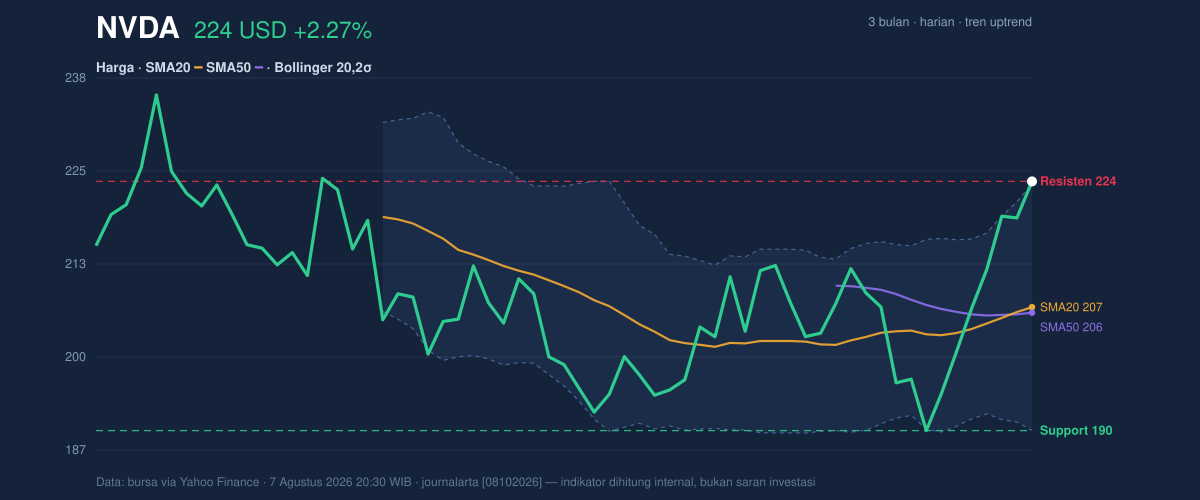
The golden cross — where the 20-day average moved above the 50-day average — is important because it often signals that shorter-term buyers have gained control over the medium-term trend. In plain English, it means recent price strength has become strong enough to pull the trend line above the slower one, a pattern traders watch for confirmation that momentum is improving.
Still, the stock is now sitting at the edge of its short-term envelope. The upper Bollinger band at 223.62 is essentially being tested by the last price of 223.96, and the %B reading of 101% shows the shares are trading just beyond the upper band. That does not automatically mean reversal, but it does mean the stock is stretched relative to its recent average. When price runs above the top band, it usually signals strong demand — and also a higher chance of near-term consolidation if buyers pause.
The broader range also matters. Nvidia is near the top of its 3-month range of 189.80 to 236.54, which tells us the market has recovered a large portion of the prior drawdown. The current 20-hour resistance at 223.96 is now being matched by the last price itself, so the next move will be about whether the stock can turn this level into support rather than merely touch it.
Oscillators & Momentum
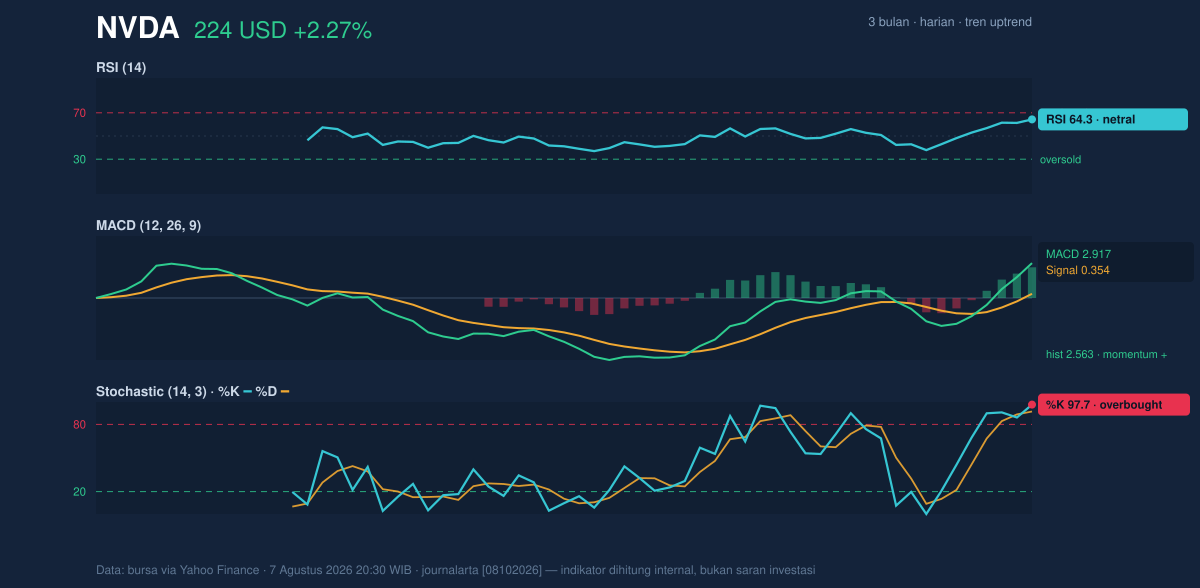
The momentum picture is mixed, and that mix is the story. The RSI at 64.3 sits in neutral territory, which means the stock is not yet at a classic exhaustion point. But the Stochastic %K at 97.7 and %D at 91.5 are firmly overbought, showing price has moved faster than the recent trend can comfortably absorb. In practical terms, stochastic overbought conditions often appear when a stock is running hard near resistance; they do not guarantee a drop, but they do warn that upside may become more selective.
The MACD at 2.917 versus a signal line at 0.354, with a histogram of 2.563, points the other way: trend momentum is still positive and strengthening. The MACD histogram is especially useful because it shows the distance between the MACD line and the signal line; a wide positive gap means the trend is still accelerating, not just drifting higher. So while stochastic says “stretched,” MACD says “trend intact.”
That combination is often seen in strong trending stocks: the trend remains healthy even as short-term oscillators become overheated. The key question is whether price can keep climbing without a pause, or whether the overbought stochastic reading starts to pull the shares into a brief cooling-off period.
Volatility & Volume
Volatility is present, but not extreme. The ATR(14) at 7.83, equal to 3.5% of price, indicates a market that can still move meaningfully in a session, but not in a disorderly way. The Bollinger band width of 16.2% is described as normal, which suggests the market is not in a compression phase that usually precedes a breakout, nor in an unusually wide, unstable phase. In other words, the setup is more about trend continuation than a volatility squeeze.
Volume is less convincing than price. Last volume was 105,473,700, below the 20-hour average of 127,213,930, or about 0.8x normal. That matters because a rally built on lighter turnover can be easier to extend in the short run, but it is also less decisive than one backed by heavier participation. The positive counterweight is that OBV is rising, which means the balance of volume has still favored accumulation over distribution. That is a subtle but important signal: even if the day’s turnover is lighter than average, the broader flow of shares has not turned negative.
Key Levels & Scenarios
The nearest technical reference points are clear. 223.96 is both the last price and the current resistance marker, making it the immediate level to watch. Below that, the first major structural support sits near the 20-day SMA at 206.82 and the 50-day SMA at 206.07, a zone that now acts as the trend’s foundation. Deeper support is visible near the 20-hour range low at 190.01 and the 3-month low at 189.80.
If price can hold above the 223.62 upper Bollinger band and stay above the moving averages, the chart suggests the market is attempting to convert overextended strength into a new plateau. If it slips back below the 206.82/206.07 area, the message changes: the golden cross would still exist, but the immediate breakout attempt would lose force and the market would likely need to rebuild momentum.
Technical Verdict: HOLD (wait & see)
HOLD (wait & see)
- Reason 1: Trend is positive — price is above both the SMA20 and SMA50, and the golden cross supports the uptrend.
- Reason 2: Momentum is strong but stretched — the MACD remains positive, yet Stochastic is overbought and price is above the upper Bollinger band.
- Reason 3: Participation is not fully confirming — volume is 0.8x normal, even though OBV is rising.
- Invalidation condition: this verdict is invalidated if price falls below 206.07.
- Ideal entry range: 206.07 to 206.82
- Exit target: 223.62 to 223.96
- Stop loss protection: below 190.01
For non-traders, this means the stock trend is still upward, but it is moving fast enough that the chart is asking for confirmation before the next leg higher. Nvidia’s 3-month high stands at 236.54.
Summary Data NVDA
| Last price | 223.96 USD |
| Change 1 day / 5 days / 1 month | 2.27% / 11.56% / 6.16% |
| Trend / MA-cross | uptrend / golden |
| SMA20 / SMA50 | 206.82 / 206.07 |
| RSI (14) / Stochastic %K | 64.3 / 97.7 |
| Bollinger %B / ATR | 101% / 7.83 |
| Support / Resistance 20 days | 190.01 / 223.96 |
| Data as of | 7 Agustus 2026 20:30 WIB |

