OCBC Stock Gains 3.31% Today, RSI Overbought
On Agustus 10, 2026: price 30.30 SGD, trend uptrend, RSI 72.7, support 27.48, resistance 30.30. technical analysis of ocbc stock. OCBC Stock Gains — full…

OCBC Bank’s shares on SGX rose to 30.30 SGD as of 7 August 2026 08:00 WIB, up 3.31% on the day and extending a 10.46% gain over the past month, according to data from the exchange via Yahoo Finance. The move leaves the stock pressing against the top of its recent trading band, and that matters: when a bank stock climbs to the edge of a range with volume rising, it usually signals that buyers are still in control, but also that the market is testing whether the next leg higher can be sustained rather than simply extended.
Trend & Price Action
The wider structure remains constructive. OCBC is trading above both the SMA20 at 28.88 and the SMA50 at 26.40, which means the short-term and medium-term averages are both supporting the price rather than capping it. The SMA20 slope of 2.21% over five days confirms that the short-term trend is still rising, a useful sign because it shows the advance is not just a one-day spike. There is no fresh MA cross, so this is not a new moving-average breakout story; instead, it is a continuation pattern, with price already well above the trend lines and asking whether momentum can keep pace with the stretch.
As shown in the chart, the stock is also sitting at the top of its 20-hour support-resistance range, with 27.48 acting as nearby support and 30.30 marking the current resistance area. That placement at 100% of the range is important: it suggests the market has already priced in the latest burst of enthusiasm, so further upside now depends on follow-through rather than just trend alignment.
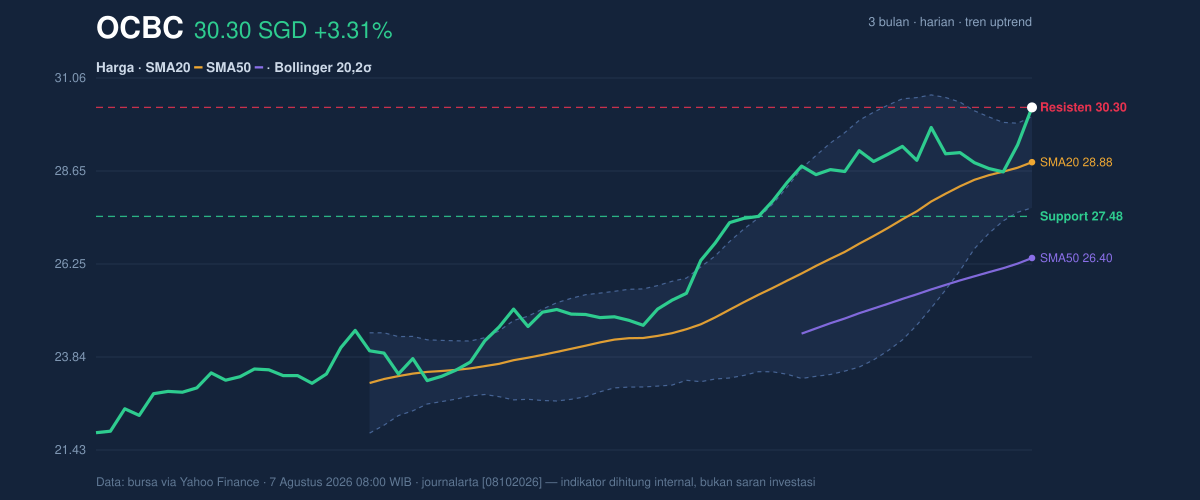
The broader range tells the same story. OCBC is trading just below its 3-month high of 30.50 and far above the 3-month low of 21.88. That distance from the low shows the rally has already done substantial work; the proximity to the high means the market is now in a zone where traders often become more selective, waiting for confirmation that the breakout is real.
Oscillators & Momentum
The momentum picture is less clean than the price chart. The RSI at 72.7 is in overbought territory, which does not automatically mean reversal, but it does mean the stock has risen fast enough that short-term conditions are stretched. The Stochastic %K at 91.1 and %D at 62.2 reinforce that message: the stock is trading near the upper end of its recent range, and short-term momentum has become extended.
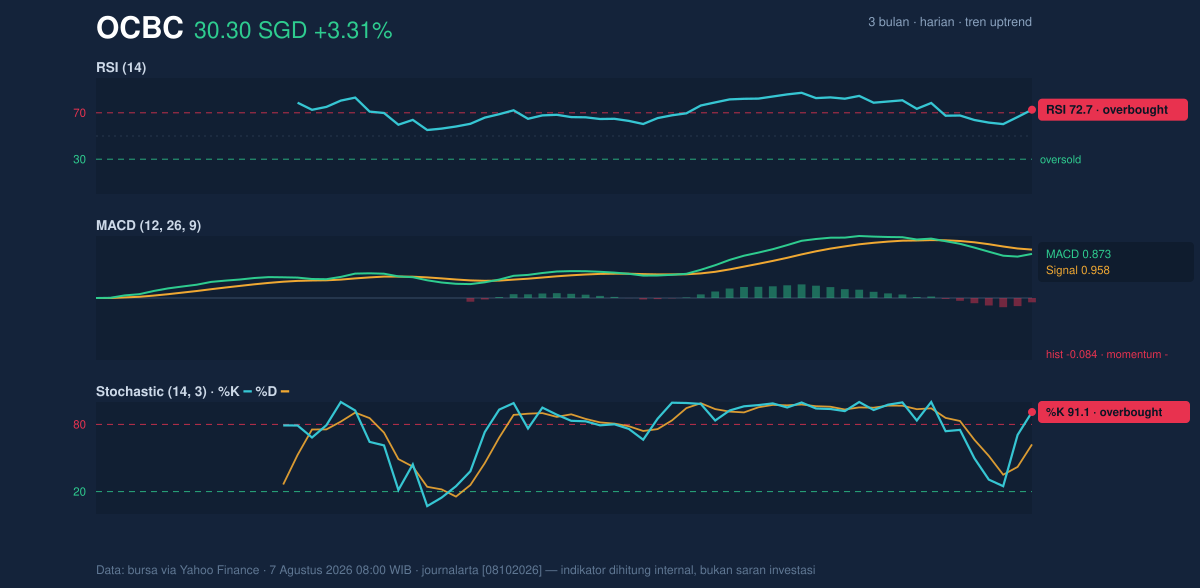
The more telling signal is the MACD at 0.873 versus a signal line at 0.958, leaving a -0.084 histogram. In plain language, MACD is still positive in absolute terms, but the histogram below zero shows the pace of the rally has started to lag behind price. That is a momentum divergence worth watching. It does not yet negate the uptrend, but it does suggest the latest climb is being driven more by price extension than by accelerating momentum, which often precedes either consolidation or a brief pullback.
Volatility & Volume
Volatility remains manageable rather than explosive. The ATR at 0.62, or 2.0% of price, indicates an average daily swing that is moderate for a stock trading near a high. The Bollinger Bands show the upper band at 30.06, the middle band at 28.88, and the lower band at 27.70, with %B at 110%. That reading means the price is trading above the upper band, a classic sign of strong momentum, but also one that often appears when a move is temporarily overextended. The 8.2% band width is normal, not squeezed, so this is not a low-volatility coil waiting to burst; it is a live trend that has already expanded.
Volume helps validate the move. The latest turnover of 12,029,000 shares was about 1.8× the 20-hour average of 6,833,945, and OBV is rising. That combination matters because volume-backed advances are generally more credible than thin rallies. Rising OBV means money flow has been accumulating alongside price, which supports the view that the advance is being broadly participated in rather than driven by a narrow burst of trading.
Key Levels & Scenarios
The immediate technical map is clear. 30.30 is the first line of resistance because it is both the latest price and the top of the current range. Above that, 30.50 is the next obvious ceiling from the 3-month high. On the downside, 28.88 is the first meaningful support because it is the SMA20 and the Bollinger middle band, while 27.70 is the lower band and 27.48 is the recent range floor.
If OCBC can hold above 30.30 and continue to trade with strong volume, the chart would suggest a test of 30.50 is the next technical challenge. If it fails to clear the current high zone, the more likely near-term outcome is sideways consolidation around the 28.88 to 30.30 area, allowing RSI and Stochastic to cool. A drop below 28.88 would be more meaningful because it would mean price has slipped back under the short-term trend line and the Bollinger midline at the same time.
Technical Verdict: HOLD (wait & see)
HOLD (wait & see)
- RSI at 72.7 and Stochastic %K at 91.1 show the stock is overbought, so the rally is extended.
- MACD histogram at -0.084 signals fading momentum even as price remains strong.
- Volume at 1.8× average and rising OBV confirm participation, so the trend is still intact.
Verdict invalidated if price falls below 28.88, which would mean OCBC has lost both its SMA20 and Bollinger middle band.
- Ideal Entry Range: 28.88 to 30.06
- Exit Target: 30.50
- Stop Loss protection: 27.70
In plain English: the stock is still strong, but it is stretched enough that the next move may be a pause before any further climb.
Summary Data OCBC
| Last price | 30.30 SGD |
| Change 1 day / 5 days / 1 month | 3.31% / 4.02% / 10.46% |
| Trend / MA-cross | uptrend / none |
| SMA20 / SMA50 | 28.88 / 26.40 |
| RSI (14) / Stochastic %K | 72.7 / 91.1 |
| Bollinger %B / ATR | 110% / 0.62 |
| Support / Resistance 20 days | 27.48 / 30.30 |
| Data as of | 7 Agustus 2026 08:00 WIB |

