ORCL Stock Gains 2.47%, Testing Key Resistance In Focus
On Agustus 10, 2026: price 147.02 USD, trend sideways, RSI 56.3, support 114.99, resistance 147.02. technical analysis of orcl stock. ORCL Stock Gains — full…

Oracle is trading at the top of its near-term range, and the market is now asking whether this is a breakout attempt or simply a stretched move after a sharp run. As of 7 August 2026, Oracle shares on the NYSE were at 147.02 USD, up 2.47% on the day, after a 13.21% gain over five days, according to Yahoo Finance data cited in the market feed.
Trend & Price Action
The broad message from the chart is constructive but not cleanly bullish. Oracle is trading above its SMA20 at 129.47, which tells traders the short-term trend has improved materially over the past few sessions. But it remains below the SMA50 at 160.29, so the medium-term trend has not yet fully turned in the stock’s favor. That gap matters: when price sits between the two moving averages, it often signals a recovery phase rather than a confirmed trend shift.
The slope of the SMA20 is only 0.46% over five days, which points to a sideways structure rather than a strong trending climb. In plain language, the stock is moving up, but not with the kind of steady, directional push that usually defines a durable breakout. The chart also shows no fresh MA-cross, meaning there has been no new moving-average crossover to formally confirm a trend change.
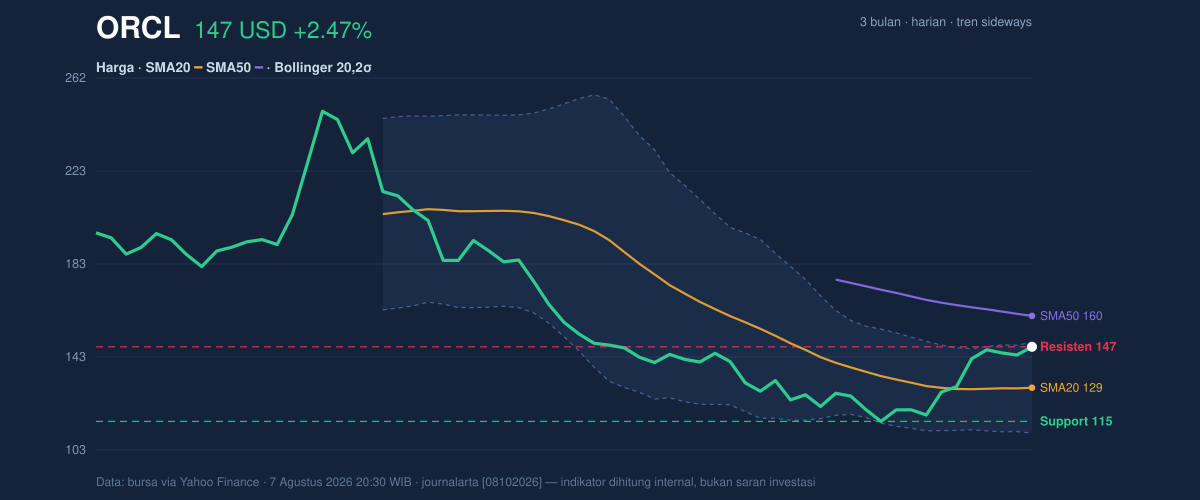
The most important detail is location: Oracle is sitting at the 100% mark of its 20-hour range, with 147.02 also acting as the current resistance level. That means the stock is pressing against the upper edge of its recent trading band, not comfortably inside it.
That position is powerful — and fragile.
Oscillators & Momentum
Momentum indicators are sending mixed but useful signals. The RSI at 56.3 is still neutral, which suggests the stock is not yet in an overheated state on that measure. RSI is a gauge of recent price strength; readings near 50 are typically balanced, while much higher levels can indicate stretched conditions. Oracle is above that midpoint, so buyers have the edge, but not by a huge margin.
The more cautionary signal comes from the stochastic oscillator: %K at 95.1 and %D at 89.1 are both in overbought territory. Stochastic tends to react quickly to recent price movement, so a reading this high often means the stock has advanced quickly enough that short-term traders may start locking in gains. Overbought does not mean a reversal is guaranteed, but it does mean upside can become harder to sustain without a pause.
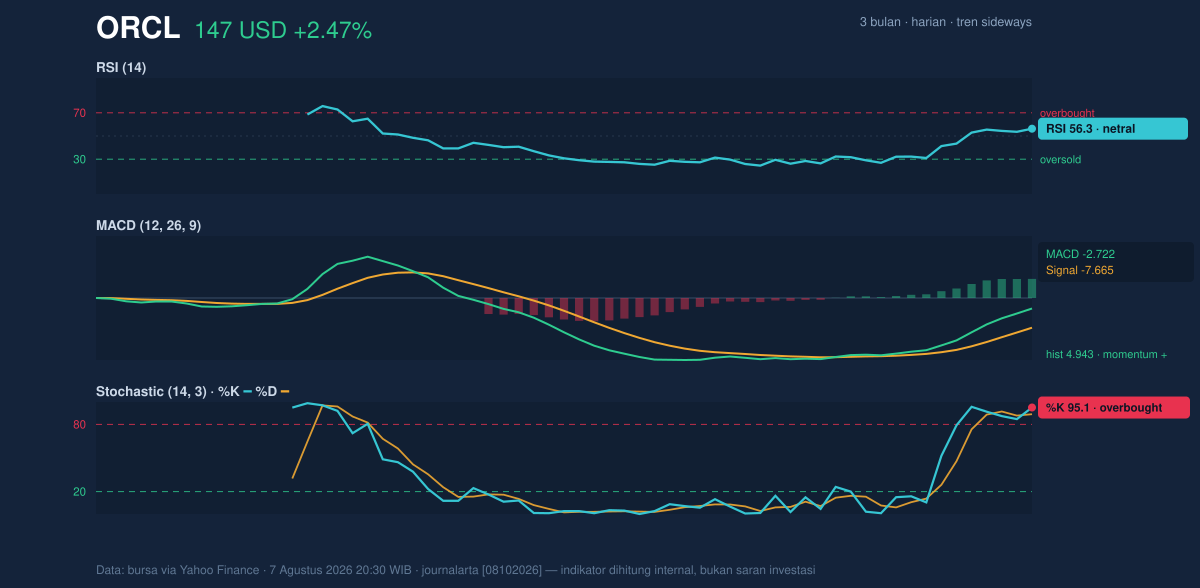
MACD is the counterweight here. The MACD at -2.722, with the signal line at -7.665 and a positive histogram of 4.943, indicates improving momentum. The histogram turning positive means the MACD line has moved above the signal line, which is often read as a bullish momentum shift. In other words, the stock is recovering strength even though it has not yet fully escaped the broader range.
That combination — neutral RSI, overbought stochastic, and positive MACD momentum — usually describes a stock that is strong enough to keep moving, but stretched enough to be vulnerable to a pause.
Volatility & Volume
Volatility is elevated. Oracle’s ATR(14) at 7.16, or 4.9% of price, means the stock is capable of relatively wide daily swings. ATR, or average true range, is not a direction signal; it measures how much the share price tends to move. A higher reading here tells readers to expect larger intraday noise and less forgiving pullbacks.
The Bollinger Bands reinforce that message. Oracle’s price is near the upper band at 148.98, with a %B reading of 95% and a band width of 30.1%. %B near 100% means price is hugging the top of its volatility envelope, a sign of strong momentum but also of limited immediate room before the stock hits the band ceiling. The widening of the bands suggests volatility is expanding, which often accompanies decisive moves — but those moves can go either way.
Volume, however, is not fully confirming the rally. Last volume was 22,808,500, below the 20-hour average of 37,589,530, or about 0.6x normal. That matters because a move to the top of the range on lighter volume can indicate that buyers are not yet committing aggressively enough to prove the breakout. Still, OBV is rising, and that means the cumulative volume trend has been improving even if the latest session was quieter than average.
The message is simple: price is strong, but participation is not overwhelming.
Key Levels & Scenarios
The chart’s immediate reference points are clear. 147.02 is both the last price and the near-term resistance. On the downside, 114.99 is the key support from the 20-hour range, while the 114.50 three-month low sits just below it as the deeper structural floor. Above the market, the next major overhead reference is the 148.98 Bollinger upper band; beyond that, the stock would need to prove it can hold momentum above the recent ceiling before the market starts treating the move as more than a short squeeze or fast rebound.
If Oracle breaks and holds above 147.02 to 148.98, the chart would be signaling that buyers are willing to pay up even at the edge of the volatility band. If it fails to hold 129.47, the SMA20, the tone would shift from recovery to consolidation. And if it falls below 114.99, the recent advance would lose its short-term technical base.
Technical Verdict: HOLD (wait & see)
HOLD (wait & see)
- MACD histogram is positive at 4.943, showing momentum has improved.
- Stochastic is overbought at 95.1 / 89.1, which raises the risk of a pause after the recent surge.
- Price is at 95% of Bollinger range and right under 147.02 resistance, so upside is stretched in the short term.
- Verdict invalidated if price falls below 114.99, which would weaken the current recovery structure.
- Ideal entry range: 129.47 to 147.02
- Exit target: 148.98
- Stop loss protection: 114.99
For non-traders, this means Oracle looks stronger than it did a week ago, but the share price is now close to a technical ceiling and the next move needs confirmation rather than assumption.
“The stock has momentum, but it is now close enough to resistance that the market will have to prove this is a real breakout, not just a fast climb.”
Summary Data ORCL
| Last price | 147.02 USD |
| Change 1 day / 5 days / 1 month | 2.47% / 13.21% / 4.54% |
| Trend / MA-cross | sideways / none |
| SMA20 / SMA50 | 129.47 / 160.29 |
| RSI (14) / Stochastic %K | 56.3 / 95.1 |
| Bollinger %B / ATR | 95% / 7.16 |
| Support / Resistance 20 days | 114.99 / 147.02 |
| Data as of | 7 Agustus 2026 20:30 WIB |

