Singtel Stock Analysis: Drops 0.92%, Testing Support Level
On Agustus 10, 2026: price 4.30 SGD, trend sideways, RSI 39.6, support 4.30, resistance 4.61. technical analysis of singtel stock. Singtel Stock Analysis —…

Singapore Telecom (Singtel) fell to SGD 4.30 on SGX, down from 4.34, as the stock drifted to the bottom of its recent trading range and hovered just above its short-term support, according to data from Yahoo Finance. The move matters less for its size than for what it signals: the shares are no longer pressing higher on momentum, but neither are they breaking down decisively, leaving the chart in a fragile pause where weakness is obvious and a rebound still needs proof.
Trend & Price Action
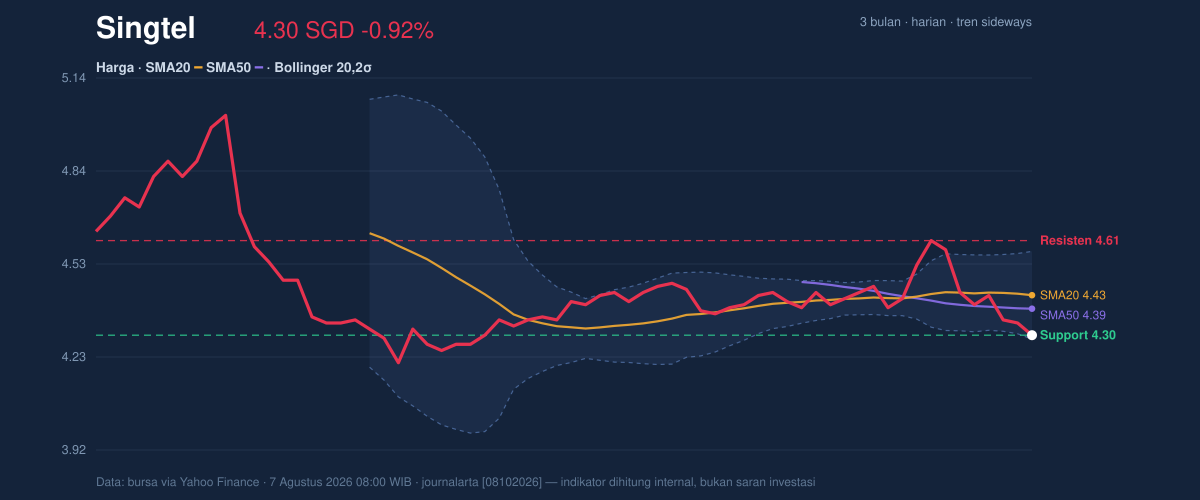
The price is sitting below its SMA20 at 4.43 while remaining slightly above the SMA50 at 4.39, which is a classic sign of a stock that has lost near-term traction but has not yet surrendered its medium-term base. In plain terms, the 20-day average is the faster trend gauge, so trading under it shows recent selling pressure is stronger than the latest buying interest. The fact that the stock is above the 50-day average keeps the broader structure from turning outright bearish, but the tone is still cautious because the short-term slope of the SMA20 is negative at -0.19% over 5 days.
There is no fresh MA cross, so the chart is not offering a clean trend reversal signal. Instead, as shown in the chart, the price is compressed near the lower edge of the range, with the 20-hour support at 4.30 sitting almost exactly under the last trade and the 20-hour resistance at 4.61 still well overhead. That positioning tells traders the market is testing whether buyers will defend the floor or whether the next move will be a break into the lower part of the three-month range, which spans 4.15 to 5.05.
Oscillators & Momentum
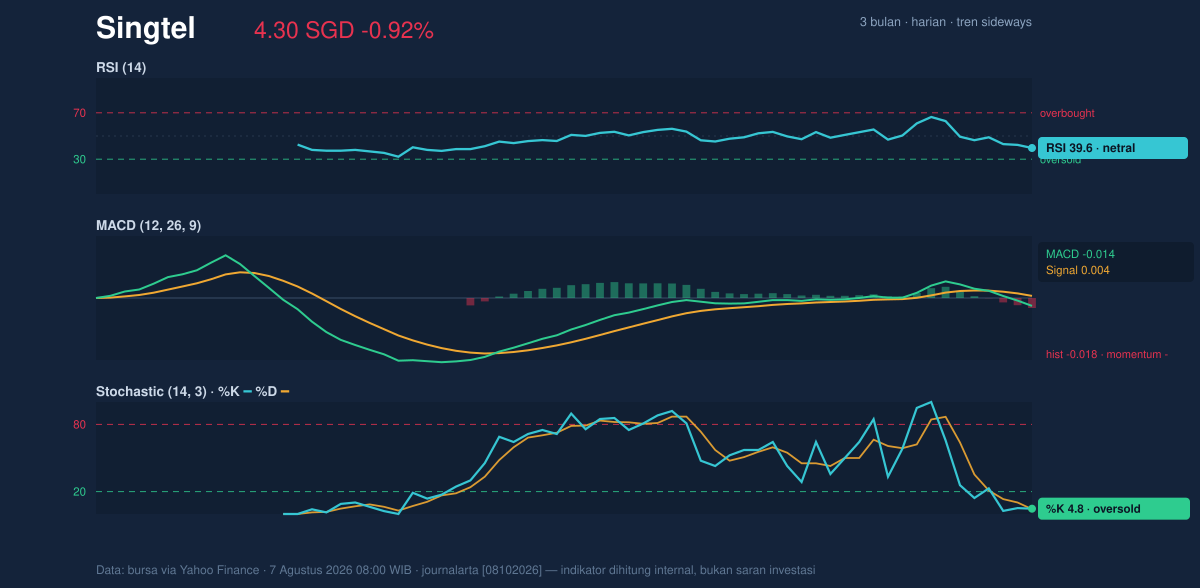
The momentum picture is mixed, but the balance still leans negative. The RSI at 39.6 is not oversold, yet it is below the midpoint that usually separates constructive momentum from defensive trading. That means the stock is weak, but not at the kind of extreme that typically forces a snapback on its own.
The more interesting signal comes from the stochastic oscillator, where %K at 4.8 and %D at 4.3 are both in oversold territory. This often means the stock has been sold hard enough in the very short term that downside may be stretched, but oversold does not automatically mean a rebound; it only says the decline has become mature enough that traders will start watching for stabilization. The MACD at -0.014, still below its signal line at 0.004 with a -0.018 histogram, confirms that the trend impulse remains negative. In other words, the stock is not yet showing the momentum turn that would validate a recovery attempt, even if the stochastic line suggests the selloff is becoming tired.
Volatility & Volume
The Bollinger Bands tell a useful story here. The stock is trading near the lower band at 4.29, with %B at 4%, which means it is positioned almost at the bottom of the band structure rather than near the middle or upper edge. That is a sign of persistent pressure, but the 6.5% band width is also narrowing, pointing to a squeeze. A squeeze matters because it often precedes a sharper move, but it does not reveal direction by itself; it simply says the market is storing energy after a period of quieter trading.
Volume does not yet support a convincing turn. Last volume was 29,689,500, below the 20-hour average of 32,177,085, or about 0.9× normal. That tells you the latest decline was not accompanied by a burst of panic selling, but it also means buyers have not stepped in with enough force to reverse the tape. The declining OBV, or on-balance volume, reinforces that reading: more trading has been happening on down days than on up days, which is a subtle but important sign that participation has favored sellers.
ATR at 0.09, equal to 2.2% of price, suggests volatility is moderate rather than explosive. That fits the broader picture of a stock that is coiling near support, where the next meaningful move may come only after the current compression resolves.
Key Levels & Scenarios
The immediate line in the sand is 4.30. Because the stock is already trading at that level, a clean hold would be the first sign that the lower band and short-term support are doing their job. If that floor gives way, the chart would likely shift attention toward the lower end of the recent range and then the 3-month low at 4.15, which is the next clearly defined reference point from the data.
On the upside, the first meaningful hurdle is 4.43, the SMA20 and Bollinger middle band. That level matters because regaining it would mean the stock is no longer pinned below its short-term trend gauge. Beyond that, 4.61 is the next resistance, and a move through it would suggest the squeeze is resolving in favor of buyers rather than just producing a dead-cat bounce. As shown in the chart, the price is currently much closer to support than resistance, so the burden of proof remains on the bulls.
Technical Verdict: HOLD (wait & see)
- Reason 1: Price is below the SMA20 at 4.43, and the MACD is negative, which keeps the near-term trend under pressure.
- Reason 2: Stochastic is oversold while RSI at 39.6 is weak but not extreme, suggesting downside may be stretched, yet not reversed.
- Reason 3: Bollinger Bands are squeezing, so a larger move may be approaching, but direction is not confirmed.
- Verdict invalidated if price breaks below 4.29, the lower Bollinger band and immediate support zone.
- Ideal Entry Range: 4.29 to 4.43
- Exit Target: 4.61
- Stop Loss protection: below 4.29
For non-traders, this means the stock is sitting at a technical decision point: it has not proven a rebound, but it has also not yet broken its nearest floor.
Summary Data Singtel
| Last price | 4.30 SGD |
| Change 1 day / 5 days / 1 month | -0.92% / -3.15% / -2.27% |
| Trend / MA-cross | sideways / none |
| SMA20 / SMA50 | 4.43 / 4.39 |
| RSI (14) / Stochastic %K | 39.6 / 4.8 |
| Bollinger %B / ATR | 4% / 0.09 |
| Support / Resistance 20 days | 4.30 / 4.61 |
| Data as of | 7 Agustus 2026 08:00 WIB |


