T Stock Gains 0.34%, Golden Cross Formed In Focus
On Agustus 10, 2026: price 23.79 USD, trend uptrend, RSI 58.2, support 21.28, resistance 24.66. technical analysis of t stock. Stock Gains — full details here.

AT&T closed at 23.79 USD, up 0.34% on the day and 12.59% over the past month, extending a move that has carried the stock back into the upper part of its recent trading range. The signal is not just that the shares are rising; it is that the rise is now being reinforced by trend indicators, even as participation remains thin. That mix matters because it often separates a durable advance from a quick squeeze.
Trend & Price Action
As shown in the chart, the share price is trading above the SMA20 at 22.97 and above the SMA50 at 22.68, with the 20-day average now turning higher at a 2.81% five-day slope. That is the textbook shape of an improving trend: short-term prices are not only above the average, the average itself is rising. The golden cross — where the SMA20 moves above the SMA50 — is especially important because it signals that recent buying pressure has overtaken the slower longer-term pace. In plain language, the market has stopped treating rallies as temporary and is beginning to price in a more constructive path.
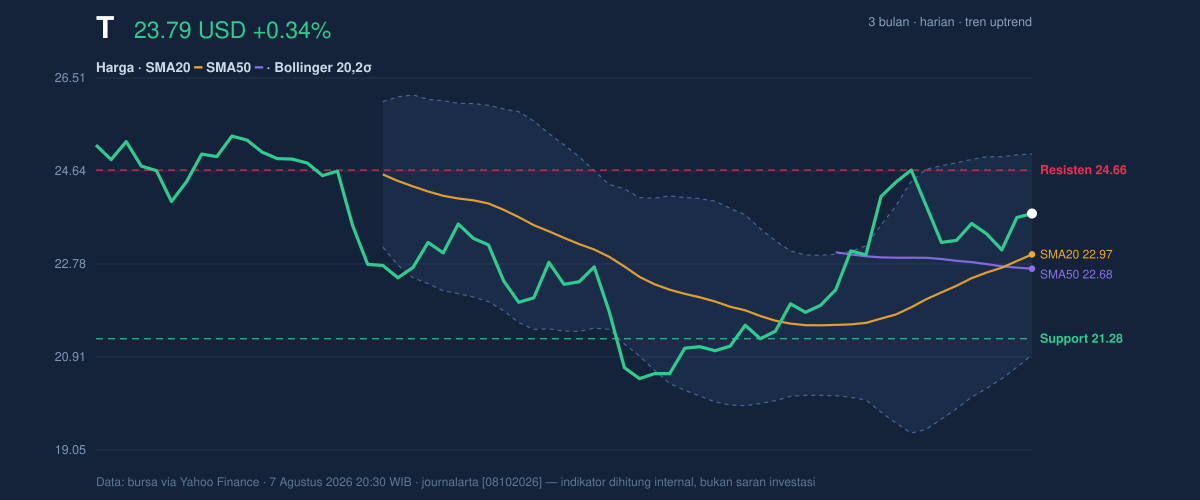
The stock is also sitting at 74% of its 20-hour range, near the upper half of the recent band between 21.28 support and 24.66 resistance. That positioning says buyers have regained control, but not enough to claim a breakout. The broader three-month range — 25.55 high to 19.89 low — shows there is still room for the shares to recover further before they approach the prior ceiling. For now, the price is pressing toward resistance rather than retreating from it, which is the right location for a trend to prove itself.
Oscillators & Momentum
Momentum is supportive, but not stretched. The RSI at 58.2 is neutral-to-firm, which means the stock has room to continue rising without immediately entering the overheated zone that often attracts profit-taking. The Stochastic reading of 57.7/%D 51.8 is also neutral, and that matters because it suggests the move is still developing rather than becoming exhausted. In other words, the oscillators are not flashing a reversal warning; they are saying the advance is orderly.
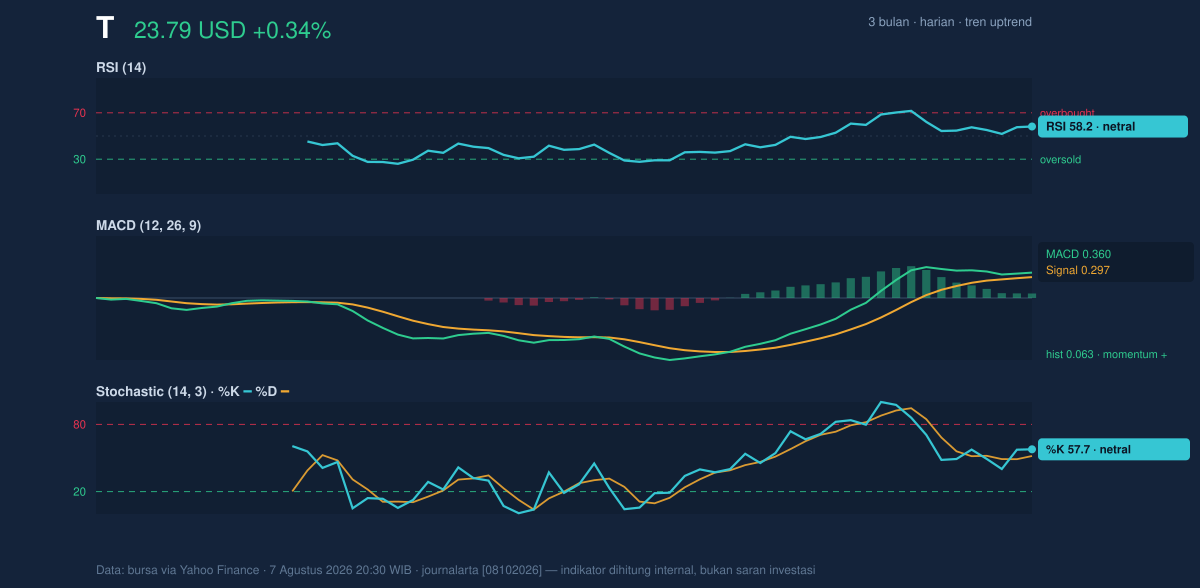
The cleaner confirmation comes from the MACD at 0.360, above its signal line at 0.297, with a positive histogram of 0.063. That combination indicates upward momentum is still expanding. MACD is useful here because it measures whether recent price gains are gaining or losing force. A positive histogram means the faster trend is still pulling ahead of the slower one. Put simply, the stock is not merely drifting higher; its recent gains are still being validated by trend momentum.
Volatility & Volume
The Bollinger bands help frame how much of the recent move has already been priced in. With the upper band at 24.98, middle band at 22.97, and lower band at 20.96, the stock is trading above the center line and below the top band, with %B at 70%. That usually means the price is leaning toward the upper half of its volatility envelope, but has not yet reached the kind of extreme that often precedes a snapback. The 17.5% band width is described as normal, which suggests the market is not in a volatility squeeze waiting to explode, nor in a disorderly expansion. This is a steady trend environment, not a panic or a breakout compression setup.
Volume, however, is the caution flag. Last trading volume was 34,866,000, only 0.5x the 20-day average of 76,680,355. That means the move higher has been achieved with relatively quiet participation. When a stock rises on light volume, it can still advance, but the move is less convincing than one backed by broad turnover. The encouraging counterweight is that OBV is rising, which suggests that despite the muted headline volume, the broader balance of accumulation has been improving. In practical terms, money is still drifting into the stock, even if not in a rush.
Key Levels & Scenarios
The near-term map is clear. 24.66 is the first resistance to watch, and 24.98 is the Bollinger upper band that may act as a secondary ceiling. A clean move through those levels would show the stock is no longer just climbing within its range, but attempting to challenge the top of its volatility envelope. On the downside, 22.97 — the SMA20 and Bollinger middle band — is the first important test of trend health. If that level gives way, the move would look less like a fresh advance and more like a fading rebound. Below that, 21.28 support becomes the key line separating a controlled pullback from a deeper reset.
Technical Verdict: HOLD (wait & see)
HOLD (wait & see) fits best because the chart is constructive, but not yet decisive.
- Golden cross and price above both moving averages support the trend.
- MACD is positive, while RSI and Stochastic remain neutral, which leaves room for continuation without confirmation of acceleration.
- Volume is only 0.5x average, so the rally lacks strong participation even though OBV is rising.
Verdict invalidated if price falls below 22.97; that would weaken the trend structure and put the recent advance back into question.
- Ideal entry range: 22.97 to 23.79
- Exit target: 24.66 to 24.98
- Stop loss protection: 21.28
For non-traders: the stock is improving, but it still needs stronger proof from volume and a break above resistance before the move looks fully convincing.
“Right now, the market is saying the trend is healthier than it was — but it has not yet shouted that the next leg is secure.”
Summary Data T
| Last price | 23.79 USD |
| Change 1 day / 5 days / 1 month | 0.34% / 2.32% / 12.59% |
| Trend / MA-cross | uptrend / golden |
| SMA20 / SMA50 | 22.97 / 22.68 |
| RSI (14) / Stochastic %K | 58.2 / 57.7 |
| Bollinger %B / ATR | 70% / 0.78 |
| Support / Resistance 20 days | 21.28 / 24.66 |
| Data as of | 7 Agustus 2026 20:30 WIB |
