Testing Key Resistance, HD Stock Gains 1.75% Today
On Agustus 10, 2026: price 355.62 USD, trend uptrend, RSI 61.3, support 324.71, resistance 355.62. technical analysis of hd stock. Testing Key Resistance —…

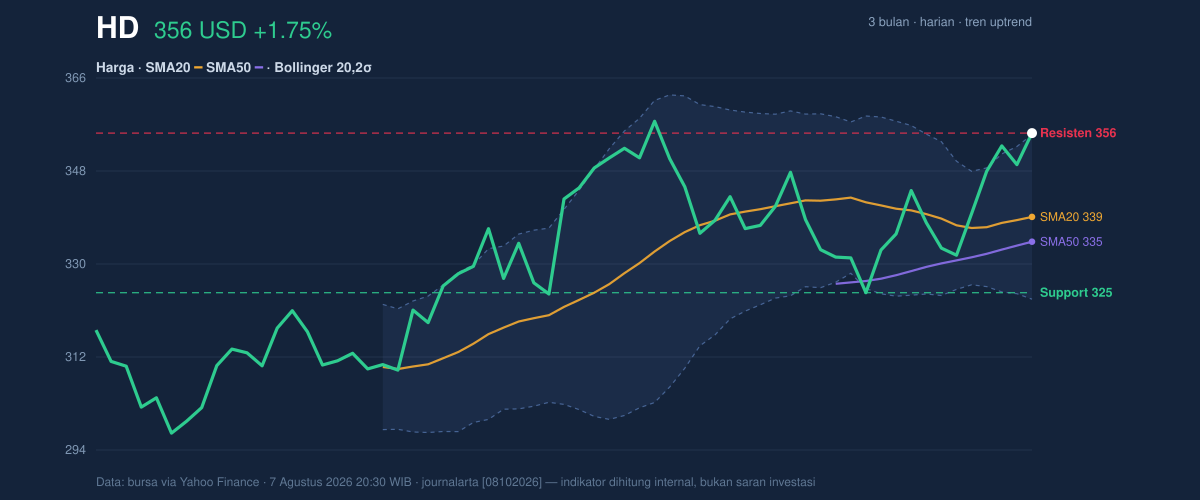
Home Depot (HD) last traded at 355.62 USD on the NYSE, up 1.75% on the day and 7.13% over five days, according to Yahoo Finance data cited at 7 August 2026 20:30 WIB. The move leaves the stock pressing against the upper edge of its recent range, with price now sitting above the SMA20 at 339.38 and above the SMA50 at 334.58. That matters because it shows the rally is not just a one-session bounce: the shares are trading in an established uptrend, but they are also close enough to resistance that the market is asking whether buyers still have enough strength to extend the run.
Trend & Price Action
As shown in the chart, Home Depot is trading with a clear short-term bullish structure: the SMA20 is rising at 0.48% over five days, and price remains above both the 20-day and 50-day averages. In plain terms, that means the recent trend is still pointing upward and the stock has been closing in stronger territory than its medium-term baseline. The absence of a new MA-cross is important too. A moving-average cross is often treated as a trend signal; here, the lack of a fresh crossover suggests the current advance is being driven more by continuation than by a dramatic new technical regime shift.
The stock is also trading near the top of its recent range, with a 3-month high of 358.85 and 3-month low of 289.10. That proximity to the high tells us momentum has carried price into a zone where traders often become more selective. The market is not cheap on a chart basis, but it is still trending.
That is the key tension.
Oscillators & Momentum
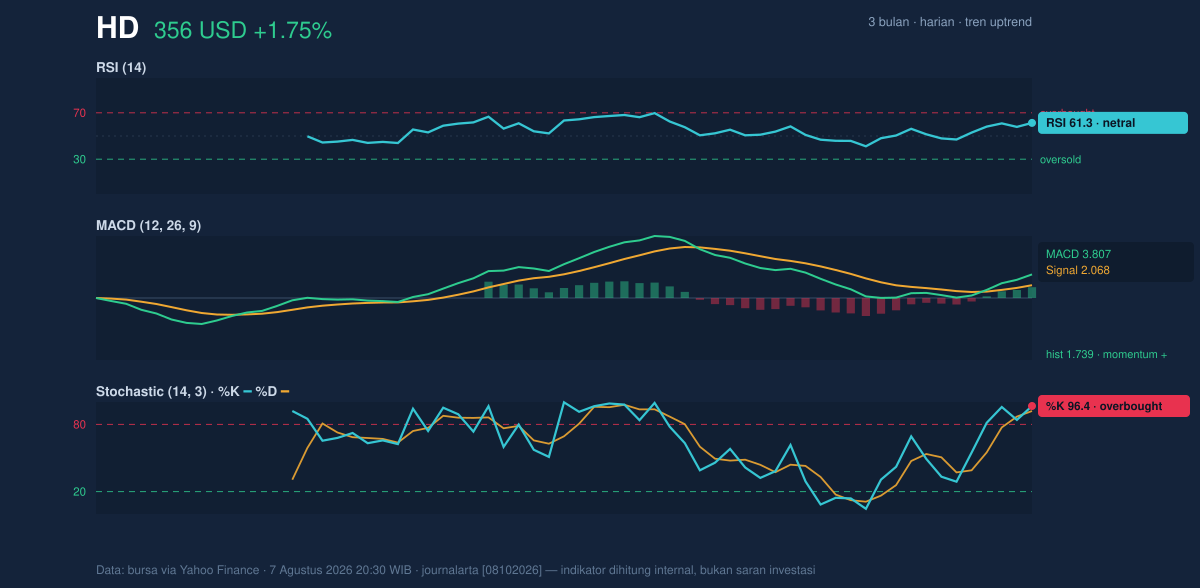
The momentum picture is mixed, even though the trend remains constructive. The RSI at 61.3 is still neutral, which means the stock has room to rise before it enters the more crowded overbought zone. But the Stochastic readings at 96.4 / 92.0 are firmly overbought, and that usually signals price has advanced quickly relative to its recent trading band. In practical terms, Stochastic is telling us the stock is near the top of its short-term range and may be vulnerable to pauses or pullbacks, even if the broader trend has not broken.
The MACD at 3.807 versus a signal line at 2.068, with a positive histogram of 1.739, says the trend’s internal momentum is still positive. The histogram being above zero means the faster-moving average is still outperforming the slower one, which usually supports continuation. So the oscillators are not fully aligned: RSI and MACD are constructive, while Stochastic is flashing a short-term overheating warning.
That split often shows up near local highs.
Volatility & Volume
Home Depot’s Bollinger Bands are normal in width at 9.4%, which suggests the stock is not in a volatility squeeze or an unusually explosive expansion phase. The upper band sits at 355.33, and price at 355.62 is already nudging above it, with %B at 101%. That reading means the stock is trading slightly beyond the upper band, a sign of strength, but also a sign that price may be stretched in the short term. When shares push above the upper Bollinger Band, it often reflects strong demand; when they do so after a fast move, it can also mean the rally is extended relative to its recent average.
Volatility is not extreme: ATR at 8.43, or 2.4% of price, points to a moderate daily range. That matters because it suggests any pullback may not be disorderly, but it also means the stock can still move far enough in a session to test nearby support levels.
Volume offers a subtle caution. The latest print of 3,583,400 shares is below the 20-day average of 3,846,190, or about 0.9x normal. So while price is advancing, it is doing so without a clear surge in participation. The OBV is rising, which is constructive because it indicates cumulative buying pressure is still building over time. But the lighter-than-average volume says the latest push has not yet been backed by a decisive broadening of activity.
Strength is there. Conviction is less obvious.
Key Levels & Scenarios
The chart’s most immediate reference points are straightforward. Resistance is 355.62 on the 20-hour range measure, which is effectively where price is now trading, while support sits at 324.71. That means the stock is at the top of the measured range, not comfortably below it. The Bollinger upper band at 355.33 is an additional short-term ceiling, and the middle band at 339.38 is the first important line that would need to hold if the stock starts to cool off.
If price can remain above the upper band and keep the MACD positive, the market is signaling that buyers are still willing to pay up for continuation. If, however, the stock slips back under the 339.38 mid-band, that would suggest the recent breakout attempt is losing traction and the move may be reverting toward the middle of the range. A deeper failure toward 324.71 would weaken the bullish case more materially, because that would place price back near the lower boundary of the recent trading structure.
Technical Verdict: HOLD (wait & see)
HOLD (wait & see) is the clearest technical reading here because the trend is still upward, but the stock is also stretched at the top of its short-term band.
- MACD remains positive, which supports the ongoing uptrend.
- Stochastic is overbought, warning that the move may need to pause before it can extend cleanly.
- %B at 101% shows price is trading just beyond the upper Bollinger Band, a sign of strength but also short-term extension.
Verdict invalidated if price falls below 324.71, which would mean the stock has broken the 20-hour support zone and weakened the current bullish structure.
- Ideal Entry Range: 339.38 to 324.71
- Exit Target (Target Price): 358.85
- Stop Loss protection: below 324.71
In plain English: the chart still leans upward, but it is stretched enough that the next move matters more than the last one.
The next technical checkpoint is whether Home Depot can hold above the 355.33 upper Bollinger Band and the 358.85 three-month high on any further push.
Summary Data HD
| Last price | 355.62 USD |
| Change 1 day / 5 days / 1 month | 1.75% / 7.13% / 3.59% |
| Trend / MA-cross | uptrend / none |
| SMA20 / SMA50 | 339.38 / 334.58 |
| RSI (14) / Stochastic %K | 61.3 / 96.4 |
| Bollinger %B / ATR | 101% / 8.43 |
| Support / Resistance 20 days | 324.71 / 355.62 |
| Data as of | 7 Agustus 2026 20:30 WIB |

