UNH Stock Technicals Today: Gains 0.77%, Testing Support Level
On Agustus 10, 2026: price 407.08 USD, trend sideways, RSI 43.8, support 403.97, resistance 436.35. technical analysis of unh stock. UNH Stock Technicals —…

UnitedHealth Group (UNH) traded at 407.08 USD on the NYSE on 7 August 2026, up 0.77% from the previous close, but the move sits inside a broader weak patch that has left the shares below SMA20 at 420.27 and below SMA50 at 412.80. The chart shows a stock still trying to stabilise after a month-long slide. That matters because when a large-cap health insurer trades under both short- and medium-term averages, rallies often reflect short covering or bargain hunting rather than a clean trend reversal.
Trend & Price Action
As shown in the chart, UNH is in a sideways trend with the SMA20 slope at -0.96% over 5 days, a mild but important sign that the near-term bias is still drifting lower rather than building upward momentum. The share price is sitting close to the lower end of its recent band: 403.97 USD support and 436.35 USD resistance, with the stock positioned in the bottom 10% of that range. That placement signals fragility more than strength. A stock near the floor of its range can bounce, but it also tells traders that demand has not yet been strong enough to pull price back toward the middle of the band.
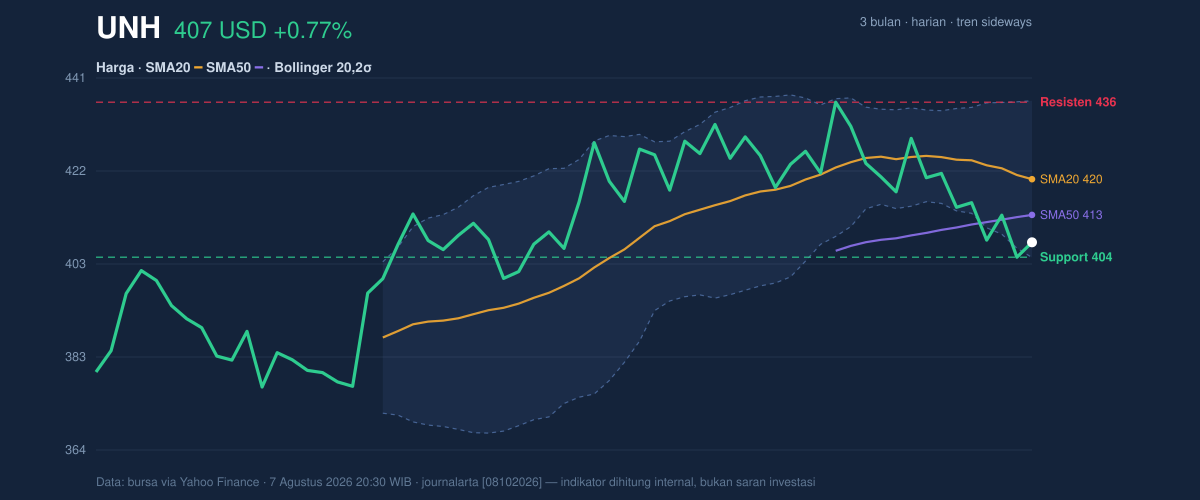
The Bollinger structure reinforces that reading. The lower band at 403.90 USD is almost on top of the market price, while the upper band at 436.63 USD remains well overhead. With %B at 10%, UNH is trading very close to the lower edge of its volatility envelope, which often means the market is compressed near support rather than trending with conviction. The 7.8% Bollinger width is also narrow, a squeeze that suggests the next decisive move could be sharper than the recent day-to-day drift. In plain language: the stock is not moving much right now, but the tighter the band gets, the more likely the eventual break becomes meaningful.
Oscillators & Momentum
The momentum picture is mixed to weak. RSI at 43.8 is neutral, which means the stock is not yet oversold enough to signal an automatic rebound, but it is also not stretched enough to warn of exhaustion on the upside. Stochastic %K at 23.7 and %D at 25.7 sit near the lower end of the scale, another sign that price is soft but not yet in a full capitulation zone. That combination usually describes a market that is losing altitude without a clear reversal trigger.
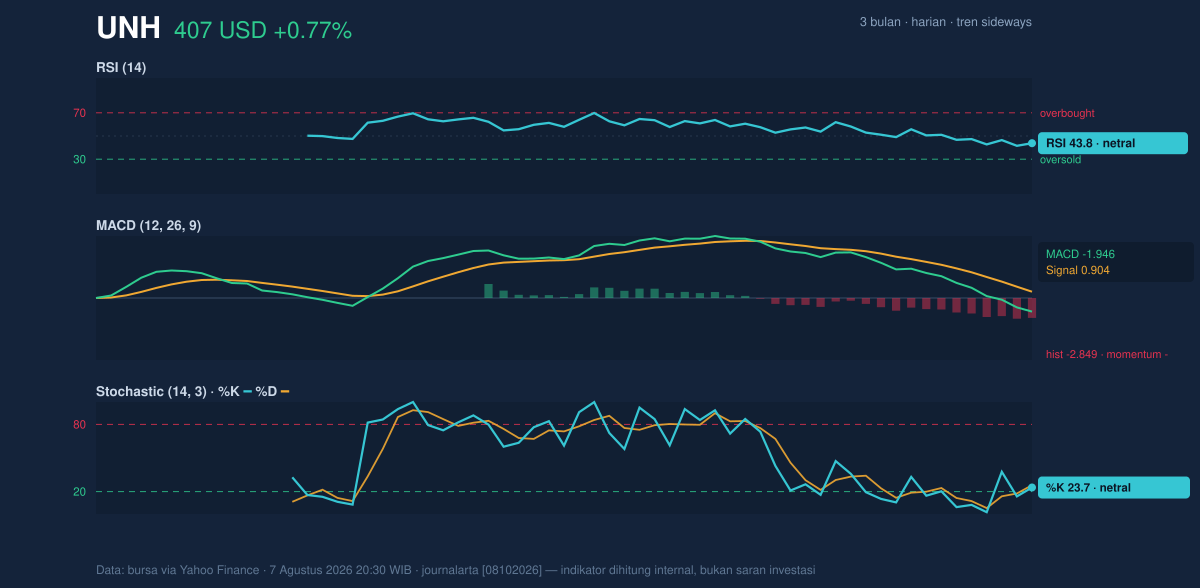
The more decisive signal comes from MACD. MACD at -1.946 remains below the signal line at 0.904, with a histogram of -2.849. For general readers, MACD measures whether recent price action is strengthening or weakening relative to the longer trend; here, it is clearly saying weakness is still in control. The negative histogram also shows the gap between the MACD line and its signal line is wide enough to indicate downside momentum has not yet fully washed out.
Volatility & Volume
Volatility is moderate rather than extreme. The ATR(14) at 11.74, equal to 2.9% of price, suggests a typical daily move can still be meaningful, but not disorderly. That matters because when a stock is sitting near support with a squeeze in place, a moderate ATR can translate into a quick break if buyers or sellers step in with conviction.
Volume does not yet confirm a base-building move. The latest print of 4,093,800 shares was only 0.7x the 20-day average of 5,515,630, and OBV is falling. OBV, or on-balance volume, tracks whether trading activity is accumulating on up days or draining away on down days. A falling OBV says participation has been more consistent with distribution than accumulation, which weakens the case that the recent bounce is being backed by institutional demand.
Key Levels & Scenarios
The key line in the sand is the 403.97 USD support, which is also the latest close area and sits almost exactly on the lower Bollinger band at 403.90 USD. If that floor holds and price starts reclaiming the 412.80 USD SMA50, the next technical checkpoint is the 420.27 USD SMA20, followed by 436.35 USD resistance. A move through that resistance would matter because it would show the market has climbed out of the lower half of the range and is no longer trading as a pressure point near the bottom.
If 403.97 USD fails to hold, the chart offers less immediate support from the provided data, and the message would shift from range-bound weakness to a deeper breakdown within the existing three-month band of 371.99 USD to 461.62 USD. The current position near the lower end of that broader range means the market is already priced close to where sellers have had the upper hand.
Technical Verdict: HOLD (wait & see)
HOLD (wait & see) fits best because the stock is sitting on support, but the trend and momentum have not yet turned convincingly higher.
- RSI at 43.8 and Stochastic at 23.7/25.7 show weakness without a clear oversold reversal signal.
- MACD at -1.946 with a -2.849 histogram keeps momentum negative.
- Volume at 0.7x average and falling OBV do not yet confirm accumulation.
Verdict invalidated if price breaks below 403.97 USD, because that would mean the lower band and near-term support have failed together.
- Ideal Entry Range: 403.97–412.80 USD, only if price stabilises above support and starts reclaiming the SMA50.
- Exit Target: 420.27 USD first, then 436.35 USD if momentum improves.
- Stop Loss protection: below 403.90 USD or, more conservatively, below 403.97 USD.
In plain English: UNH is sitting at a technical crossroads, where a rebound is possible, but the chart has not yet proved that buyers are back in charge.
The next important test is whether the shares can hold 403.97 USD support while the market watches for a move back toward 420.27 USD and the next earnings-related catalyst.
Summary Data UNH
| Last price | 407.08 USD |
| Change 1 day / 5 days / 1 month | 0.77% / -1.77% / -4.13% |
| Trend / MA-cross | sideways / none |
| SMA20 / SMA50 | 420.27 / 412.80 |
| RSI (14) / Stochastic %K | 43.8 / 23.7 |
| Bollinger %B / ATR | 10% / 11.74 |
| Support / Resistance 20 days | 403.97 / 436.35 |
| Data as of | 7 Agustus 2026 20:30 WIB |

