AstraZeneca Stock Drops 0.86% Today, Momentum Gains
On September 8, 2026: price 12,042.00 GBp, trend sideways, RSI 45.9, support 11,460.00, resistance 12,476.00. technical analysis of astrazeneca stock.

AstraZeneca’s shares on the London Stock Exchange edged lower to 12,042.00 GBp on 4 September 2026 at 14:00 WIB, slipping 0.86% from the previous close as the stock remained trapped in a broad sideways phase, according to market data from Yahoo Finance. The move matters less for its size than for what it says about conviction: the price is still holding above the short-term trend line, but it has not yet done enough to reclaim the weaker longer-term backdrop. In plain terms, AstraZeneca is neither breaking down nor breaking out, and the chart is signalling hesitation rather than direction.
Trend & Price Action
The most important structural detail is that AstraZeneca is trading above its SMA20 at 11,966.90 but still below its SMA50 at 12,618.56. That split usually means the market is respecting the near-term floor while remaining unconvinced about a fuller recovery. The stock’s sideways trend is reinforced by the SMA20 slope of just 0.13% over five days, which is effectively flat. That is a sign of balance, not momentum.
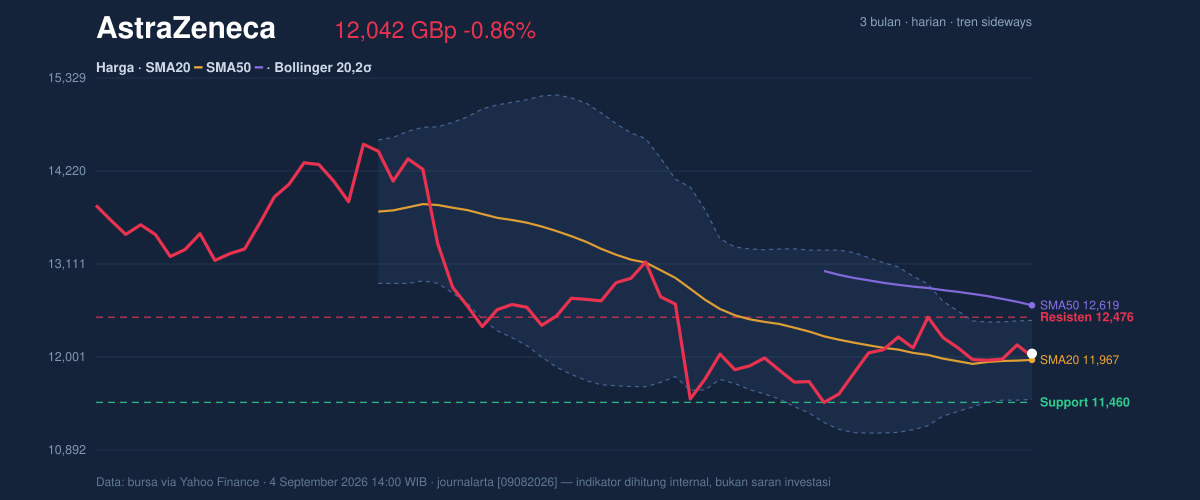
The absence of a fresh MA cross is also telling. A moving-average crossover often marks a shift in medium-term control, but here there is no new signal to suggest that buyers have wrestled back the initiative. The price sits at about 57% of the 20-day range, which puts it in the upper half without being close enough to resistance to imply a clean breakout. As shown in the chart, that leaves the stock in a middle zone where traders tend to wait for confirmation rather than chase.
The broader 3-month range gives the picture more context. AstraZeneca is well above the 3-month low of 9,892.00, yet still far below the 3-month high of 15,126.00. That gap says the stock has recovered from weakness, but not enough to restore a strong upward trend.
Oscillators & Momentum
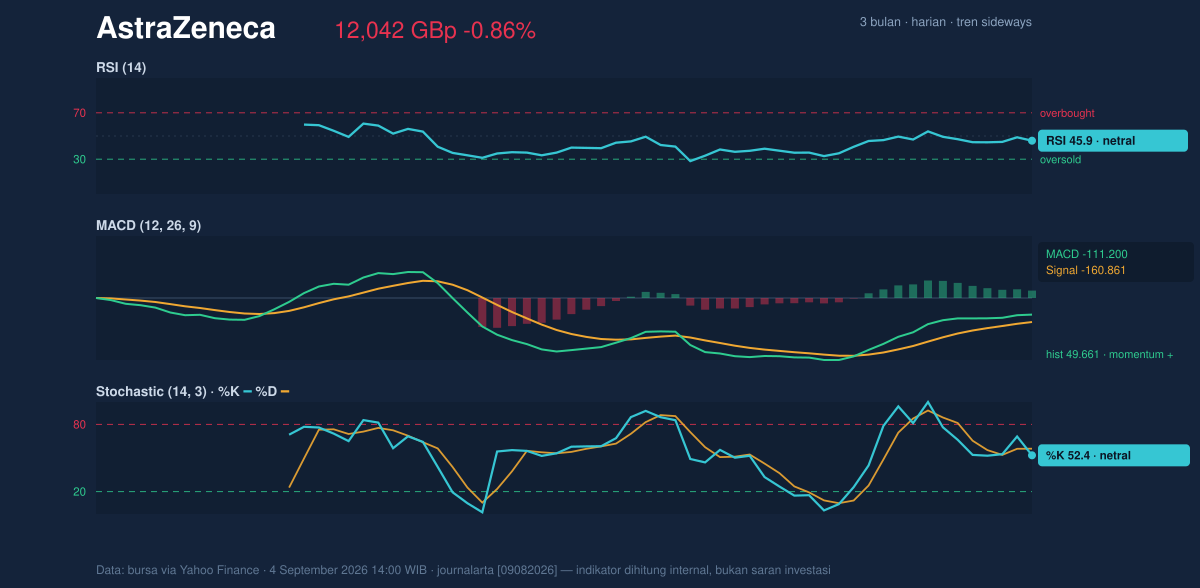
Momentum indicators are mixed, but not bearish enough to imply immediate breakdown. The RSI at 45.9 is neutral, which means the stock is neither overbought nor oversold. That matters because it leaves room for movement in either direction; the market is not stretched, so a fresh catalyst could still move the shares decisively. The Stochastic reading of 52.4 / 58.3 is also neutral, suggesting short-term momentum is balanced and not yet pointing to exhaustion or reversal.
The cleaner signal comes from MACD. AstraZeneca’s MACD at -111.200 remains below zero, which usually reflects a longer-term downtrend bias, but the signal line at -160.861 and the positive histogram of 49.661 show that downward pressure is easing. In practical terms, the stock is still technically under that heavier trend cloud, but the momentum gap is narrowing. That is not a full bullish turn, yet it does hint that sellers are losing some force.
Volatility & Volume
Bollinger Bands are adding an important layer to the story. The %B at 58% places the share price slightly above the midpoint of the band structure, and the band width of 7.9% shows a squeeze. A squeeze means volatility has compressed; when that happens, the next meaningful move can be sharper than recent trading suggests. The market is not guaranteeing direction, but it is warning that the current calm may not last.
That potential is being tested by participation data. Volume last traded at 2,248,699, or only 0.7× normal versus the 20-day average of 3,373,064. Thin volume usually weakens the reliability of any move, because fewer shares are changing hands and conviction is harder to prove. The OBV is falling as well, which means the balance of traded volume has not been supporting the price as strongly as bulls would want. In effect, the chart is saying that price is trying to stabilise, but the underlying participation is still soft.
ATR adds one more useful clue. At 295.00, equal to about 2.4% of price, volatility is moderate rather than extreme. That fits the squeeze setup: the stock is not already moving violently, but it has enough room to expand if a catalyst or technical break arrives.
Key Levels & Scenarios
The nearest technical anchors are clear. Support at 11,460.00 is the level that matters if the current range starts to fail, while resistance at 12,476.00 is the first ceiling that needs to be cleared to improve the chart’s tone. The price is currently closer to resistance than to support, but not close enough to claim control.
If AstraZeneca can push through 12,476.00, the squeeze in Bollinger Bands suggests the move could gather pace, especially if volume improves from the current 0.7× normal pace. If it fails to hold above 11,966.90, the stock would lose the support of its SMA20 and the neutral setup would weaken quickly. A break below 11,460.00 would be more serious, because it would place the share under the key 20-day support band and expose the lower part of the recent range.
Technical Verdict: HOLD (wait & see)
HOLD (wait & see)
- SMA20 support is intact, but the price remains below the SMA50, so the medium-term trend is not yet repaired.
- MACD histogram is positive, showing improving momentum, but RSI 45.9 and Stochastic 52.4 / 58.3 remain neutral rather than decisive.
- Bollinger Bands are squeezing, which raises the odds of a stronger move, but volume is only 0.7× normal and OBV is falling, so confirmation is missing.
Verdict invalidated if price breaks below 11,460.00.
- Ideal Entry Range: 11,966.90 to 12,042.00
- Exit Target: 12,476.00
- Stop Loss protection: 11,460.00
For non-traders, this means the shares are holding up, but the chart still needs stronger proof before the next move becomes clear.
AstraZeneca’s 3-month high is 15,126.00 and the 3-month low is 9,892.00.
Summary Data AstraZeneca
| Last price | 12,042.00 GBp |
| Change 1 day / 5 days / 1 month | -0.86% / -0.59% / 1.62% |
| Trend / MA-cross | sideways / none |
| SMA20 / SMA50 | 11,966.90 / 12,618.56 |
| RSI (14) / Stochastic %K | 45.9 / 52.4 |
| Bollinger %B / ATR | 58% / 295.00 |
| Support / Resistance 20 days | 11,460.00 / 12,476.00 |
| Data as of | 4 September 2026 14:00 WIB |

