Shell Testing Key Resistance: Stock Gains 1.49% (September 8, 2026)
On September 8, 2026: price 3,482.50 GBp, trend uptrend, RSI 60.0, support 3,277.50, resistance 3,443.00. technical analysis of shell stock.

Shell plc extended its rally on the LSE on 4 September, with the shares trading at 3,482.50 GBp, up 1.49% on the day, after a close above the prior 3,431.50 level. The move matters less as a single headline gain than as a signal that buyers are still willing to pay up even after the stock has pushed beyond the upper edge of its recent trading band, as shown in the chart. That is a constructive price message, but it is also a stretched one: the shares are now pressing against the top Bollinger band, which often marks a moment when momentum has to prove itself rather than simply continue.
Trend & Price Action
The broader structure remains positive. Shell is in an uptrend, with the SMA20 at 3,370.18 rising at 0.57% over 5 days, while the SMA50 at 3,238.75 sits comfortably below it. That configuration tells readers the medium-term trend is still pointing higher, and that recent weakness has not yet damaged the larger pattern. There is no new MA-cross, which means the market is not getting a fresh trend signal from moving averages; instead, it is extending an existing one.
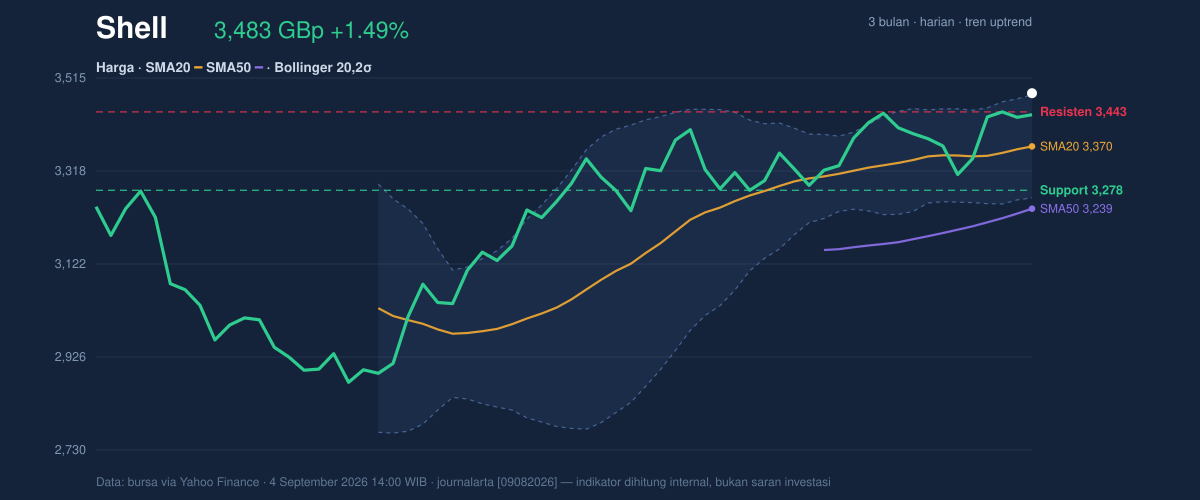
The more immediate message comes from where price sits relative to the range. The shares are trading above the 20-hour resistance at 3,443.00 and close to the 3-month high of 3,473.00. That places the stock near the top of its recent range, with little overhead room before price discovery becomes the main story. The 20-hour support at 3,277.50 remains the first level that would tell the market the breakout attempt has failed. Until then, the chart shows strength, but strength that has already been partly priced in.
Oscillators & Momentum
The oscillators are less emphatic than the price action. RSI at 60.0 is still neutral, which means the stock is not yet in an overbought condition by conventional standards, but it is also no longer in the middle of the road. The Stochastic %K at 78.6 and %D at 81.0 are also neutral, though they are hovering near the upper zone, which often suggests the rally is mature even if it is not exhausted. In plain terms, momentum is supportive, but not especially fresh.
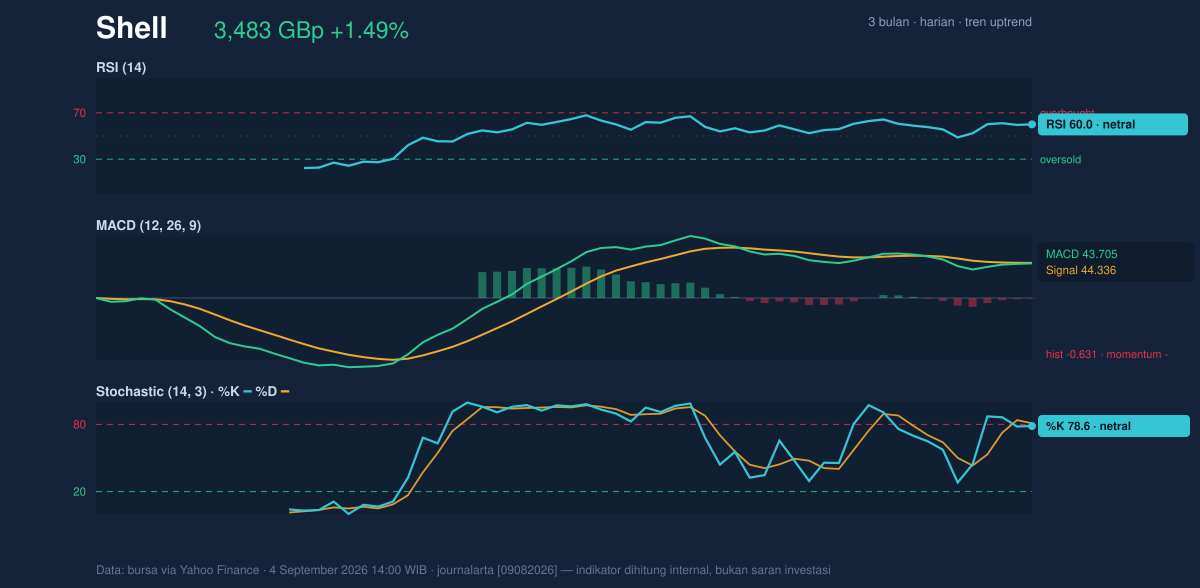
The clearest warning comes from MACD at 43.705 versus the signal line at 44.336, leaving a -0.631 histogram. That negative histogram means the faster trend measure has slipped below its signal line, a sign that upside momentum is losing some punch even while price continues to rise. This is the kind of divergence that matters: the stock can keep advancing, but the oscillator is saying the pace of that advance is slowing. For readers, that is less a reversal signal than a reminder that the market may need consolidation before another leg higher.
Volatility & Volume
The volatility backdrop is important because it explains why the current move could still run, but also why it could become abrupt. The Bollinger bands are narrowing, with a 6.4% width, which points to a squeeze and the possibility of a breakout move. Price is already above the upper band at 3,478.83, which puts Shell at 102% of the band. That is a strong sign of near-term momentum, but also a warning that the shares are extended relative to recent volatility.
Volume supports the move. Last trade volume of 12,314,657 was about 1.2× the 20-hour average of 10,578,911, and OBV is rising. OBV, or on-balance volume, tracks whether trading activity is accumulating in the direction of the trend. Rising OBV alongside above-average volume suggests the rally is not happening in thin air; there is participation behind it. The ATR at 53.25, equal to 1.5% of price, says daily movement is still moderate rather than wild, so the next move may be meaningful without necessarily being disorderly.
Key Levels & Scenarios
The stock’s nearest technical map is straightforward. Above current levels, the market is testing the area around the 3-month high of 3,473.00 and the upper Bollinger band at 3,478.83. A sustained move through that zone would confirm that the recent squeeze has resolved to the upside. Below, the first line of defense is the 20-hour resistance-turned-support at 3,443.00, followed by the more important SMA20 at 3,370.18. A failure back under the moving average would suggest the breakout has faded and that the market is reverting toward the middle of its range.
The wider context remains constructive because the shares are well above the SMA50 at 3,238.75 and far from the 3-month low of 2,559.50. That gap tells readers the primary trend has room to absorb noise, but it also shows how much of the recovery has already been realized. The market is no longer asking whether Shell can trend higher; it is asking whether buyers can keep paying up after a strong run.
Technical Verdict: HOLD (wait & see)
HOLD (wait & see) because the chart is still in an uptrend, but momentum is not fully confirming the price breakout.
- Reason 1: Price is above the SMA20 and SMA50, which keeps the trend constructive.
- Reason 2: MACD histogram is negative, showing momentum is fading even as price rises.
- Reason 3: Bollinger bands are squeezed and price is already above the upper band, so the move is extended and needs confirmation.
- Verdict invalidated if price falls below 3,370.18, because that would put Shell back under the SMA20 and weaken the current trend structure.
- Ideal Entry Range: 3,370.18 to 3,443.00
- Exit Target (Target Price): 3,478.83 to 3,473.00
- Stop Loss protection: 3,277.50
In plain English, Shell still looks healthy, but the chart is asking for proof that the rally can continue before it can be trusted.
“The market is still paying for the upside, but it is no longer doing so without hesitation.”
Summary Data Shell
| Last price | 3,482.50 GBp |
| Change 1 day / 5 days / 1 month | 1.49% / 5.18% / 5.05% |
| Trend / MA-cross | uptrend / none |
| SMA20 / SMA50 | 3,370.18 / 3,238.75 |
| RSI (14) / Stochastic %K | 60.0 / 78.6 |
| Bollinger %B / ATR | 102% / 53.25 |
| Support / Resistance 20 days | 3,277.50 / 3,443.00 |
| Data as of | 4 September 2026 14:00 WIB |


