Testing Key Resistance, BP Stock Gains 1.24% Today
On September 8, 2026: price 546.40 GBp, trend sideways, RSI 54.5, support 514.50, resistance 552.20. technical analysis of bp stock. Testing Key Resistance —…

BP plc is trading near the upper end of its recent range, with the latest move showing buyers still in control but not yet in breakout territory. The shares finished at 546.40 GBp, up 1.24% on the day and 6.01% over five days, according to exchange data via Yahoo Finance, but the broader message from the chart is more measured: the trend is improving, yet momentum is not strong enough to call it a clean trend reversal.
Trend & Price Action
The first thing to notice is where the price sits versus its moving averages. BP is trading above the SMA20 at 531.30 and also above the SMA50 at 517.65, which tells investors the stock has recovered enough to be above both its short- and medium-term averages. That matters because moving averages often act as a line between a stock in recovery and one still under pressure. Here, BP is not merely bouncing; it is holding above those reference points.
Still, the trend is officially described as sideways, and the SMA20 slope of 0.13% over five days signals only a gentle upward tilt rather than a decisive acceleration. In other words, the stock is climbing, but slowly. There is no fresh MA-cross, so the chart does not yet show a new structural signal such as a short average crossing above a longer one. As shown in the chart, that leaves BP in a constructive but unfinished setup.
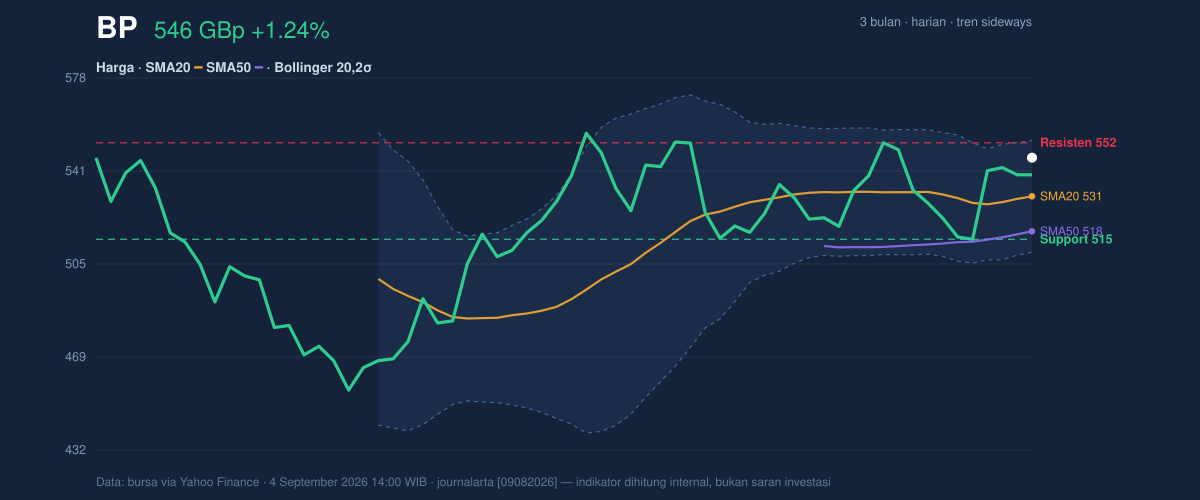
The price is also near the top of its recent band: 546.40 GBp sits close to the 20-hour resistance at 552.20 and within striking distance of the 3-month high at 562.90. That positioning is important because stocks often stall when they approach prior highs; those levels can attract profit-taking from traders who bought earlier. On the downside, the nearest floor is the 20-hour support at 514.50, with the 3-month low at 450.60 marking the larger range boundary.
Oscillators & Momentum
The momentum picture is better than the trend label suggests, but still balanced. The RSI at 54.5 is neutral, which means BP is neither overbought nor oversold. That is a healthy reading for a stock trying to build a base, because it suggests there is room for further gains without immediately triggering exhaustion signals. The Stochastic %K at 62.8 and %D at 65.0 are also neutral, but they sit in the upper half of the range, hinting that short-term momentum is positive without being stretched.
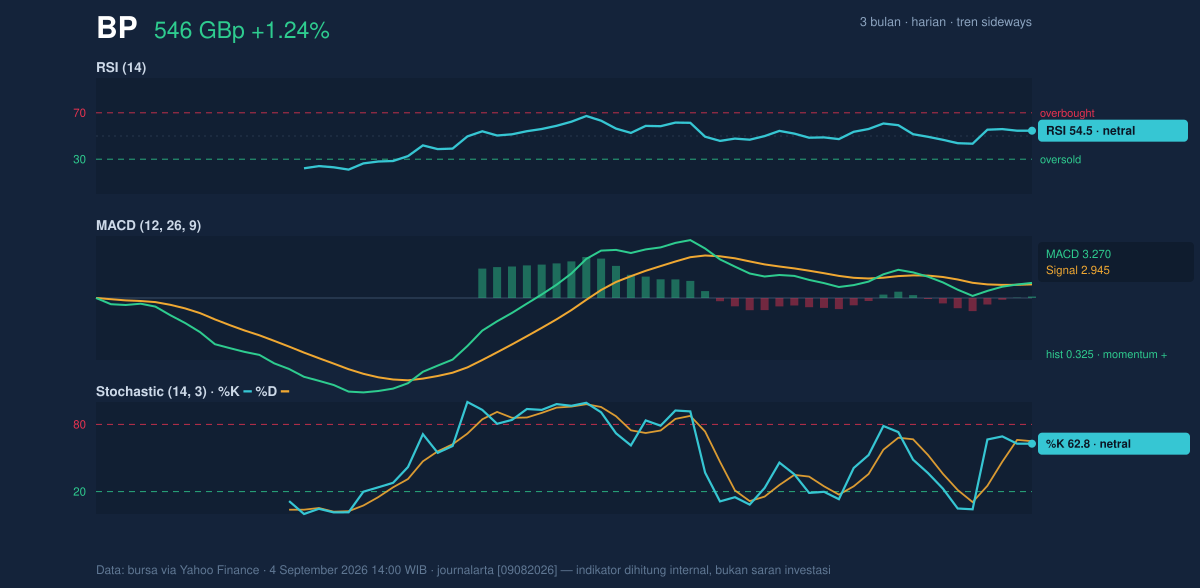
The clearest supportive signal comes from MACD: MACD 3.270 is above the signal line at 2.945, with a positive histogram of 0.325. For general readers, that means the stock’s faster trend line is moving ahead of the slower one, which usually points to improving momentum. It is not a dramatic surge, but it does confirm that recent buying has enough force to keep the chart constructive. The key nuance is that MACD is positive while RSI remains neutral — a combination that often indicates a trend is building, not yet fully established.
Volatility & Volume
Volatility is moderate rather than explosive. The ATR at 14.16, equal to 2.6% of price, suggests BP can move meaningfully in a session, but not in a disorderly way. Bollinger Bands reinforce that reading: the upper band is 553.10, the middle band 531.30, and the lower band 509.49, while the band width of 8.2% is described as normal. That means there is no squeeze warning of an imminent volatility expansion, but neither is there a sign of panic selling. Price is sitting at 85% of the Bollinger range, which shows it is leaning toward the top of the channel.
That position near the upper band is constructive, but it also raises the bar. A stock can remain near the top band during strong momentum, yet if volume does not confirm, moves can fade. Here, volume was 43,920,382, below the 20-hour average of 50,598,274, or 0.9x normal. That is the main caution flag in the data. Price is advancing, but participation is not expanding. The OBV is down, which means the cumulative volume flow is not confirming the recent price strength. In plain terms, the rally has not yet been backed by broad accumulation.
Key Levels & Scenarios
The chart’s most relevant short-term levels are clear. A sustained move above 552.20 would put the stock at the top of its recent trading corridor and bring the 562.90 three-month high into focus. If BP fails there, the first level to watch is 514.50, because that support sits below the current price but above the deeper range low at 450.60. The Bollinger middle band at 531.30 is also important: it is both the SMA20 and the center of the current volatility envelope, so a move back below it would signal the recent lift is losing traction.
Technical Verdict: HOLD (wait & see)
HOLD (wait & see)
- MACD is positive, with the histogram above zero, showing momentum is improving.
- Price is above SMA20 and SMA50, which supports the recovery structure.
- Volume is below average and OBV is down, so the move lacks full confirmation.
- Verdict invalidated if price falls below 514.50, which would break the nearest support and weaken the current setup.
Ideal levels based on the chart:
- Entry Range: 531.30 to 514.50
- Exit Target: 552.20, then 562.90
- Stop Loss protection: below 509.49
For non-traders, this means BP is improving technically, but the chart still needs stronger confirmation before the move looks fully convincing.
Summary Data BP
| Last price | 546.40 GBp |
| Change 1 day / 5 days / 1 month | 1.24% / 6.01% / 5.14% |
| Trend / MA-cross | sideways / none |
| SMA20 / SMA50 | 531.30 / 517.65 |
| RSI (14) / Stochastic %K | 54.5 / 62.8 |
| Bollinger %B / ATR | 85% / 14.16 |
| Support / Resistance 20 days | 514.50 / 552.20 |
| Data as of | 4 September 2026 14:00 WIB |


