LLY Stock Analysis: Gains 2.02%, Death Cross Pressure
On September 15, 2026: price 1,138.28 USD, trend downtrend, RSI 42.5, support 1,115.70, resistance 1,280.34. technical analysis of lly stock.

Eli Lilly shares rose 2.02% to $1,138.28 on the NYSE, but the move sits inside a broader slide: the stock is still below its 20-day and 50-day moving averages, and the chart has already printed a death cross, where the shorter average falls under the longer one. In plain terms, that usually means recent buying has not yet been strong enough to reverse the longer downtrend shown in the chart.
Trend & Price Action
The immediate signal is mixed rather than bullish. A one-day gain can look encouraging, but the stock remains 1.8% below the SMA20 at $1,181.03 and below the SMA50 at $1,183.14, which matters because moving averages often act like a crowd’s memory of fair value. When price stays under both, rallies tend to be treated as recovery attempts rather than proof of a trend change.
The slope of the SMA20 is also negative, down 1.79% over five days, reinforcing that the recent path of least resistance has been lower. As shown in the chart, Eli Lilly is trading in the lower portion of its recent range, with price at about 14% of the 20-hour range, and just above the 20-hour support at $1,115.70. That position suggests the market is still testing whether buyers can defend the lower edge of the trading band.
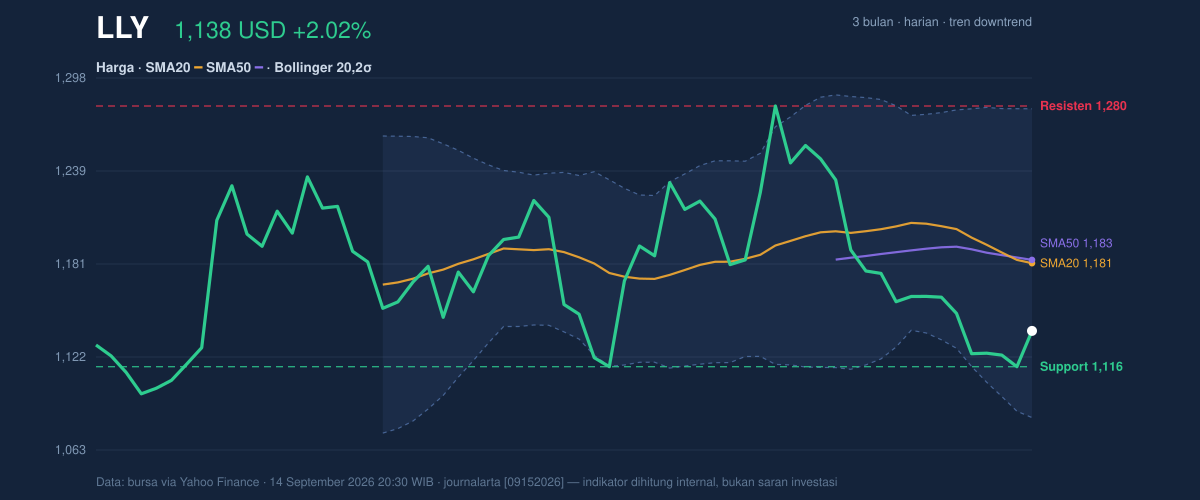
The broader three-month range adds context. The stock is closer to the 3-month low of $1,079.22 than to the 3-month high of $1,292.65, which tells readers the recent weakness is not just a one-session move; it is part of a longer retracement. The 20-hour resistance at $1,280.34 remains the first meaningful ceiling, and price is far below it.
Oscillators & Momentum
Momentum indicators are not aligned with the downtrend in a clean way, which is often what happens near turning points. The RSI at 42.5 is neutral, meaning the stock is not yet in a classic oversold condition and also not showing the kind of strength that would confirm a breakout. RSI in this zone usually says the market is cautious, not committed.
The stochastics are weaker. Stochastic %K at 16.5 and %D at 8.0 sit in oversold territory, which can signal that downside pressure is stretched in the short term. But oversold does not mean rebound; it means the stock has fallen enough that traders may start watching for a bounce, especially if price stabilizes near support. The key point is that oversold momentum can persist in a downtrend.
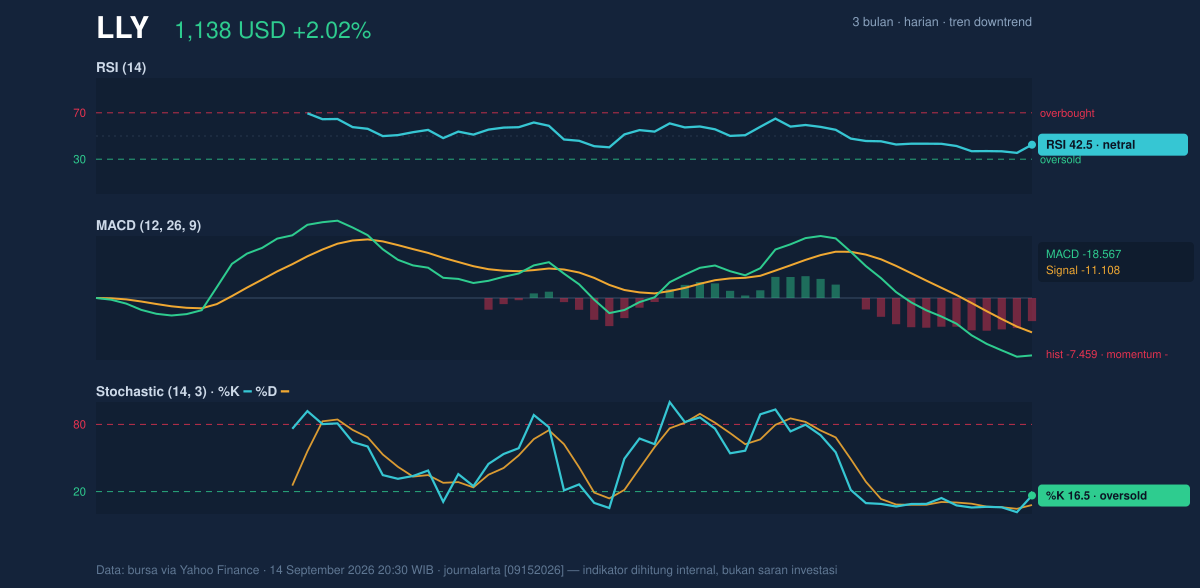
MACD is the clearest bearish signal in the set. With MACD at -18.567, below the signal line at -11.108, and a histogram of -7.459, the indicator says downside momentum is still dominant. In practical terms, the histogram being negative and wide means the gap between fast and slow trend measures is still favoring sellers, even after the day’s rebound. That is why the chart’s technical picture remains cautious despite the positive daily close.
Volatility & Volume
Volatility is moderate rather than explosive. The ATR(14) of 28.28 equals about 2.5% of price, which means the stock can still move materially in a session, but it is not flashing panic-level turbulence. The Bollinger Bands help frame that: the band width is 16.5%, described as normal, so the chart is not in a squeeze that would typically precede a sharp breakout. Instead, price is sitting near the lower part of the envelope, with %B at 28%. That reading means the stock is closer to the lower band at $1,083.51 than to the upper band at $1,278.55, a placement that often reflects pressure rather than strength.
Volume does not yet confirm a durable reversal. Last volume was 2,129,600, below the 20-day average of 2,458,125, or about 0.9x normal. When a rebound happens on lighter-than-usual trading, it can be a sign that buyers have shown up, but not in enough force to change the tape. The falling OBV, or on-balance volume, reinforces that participation has been tilting toward distribution rather than accumulation.
Key Levels & Scenarios
The nearest support to watch is $1,115.70. That level matters because it is both the current 20-hour support and close to the latest close, so it is the first line where buyers have recently been willing to step in. If that floor gives way, the next reference is the lower Bollinger Band at $1,083.51, with the 3-month low at $1,079.22 just beneath it. A break there would signal the downtrend is still in control.
On the upside, the first hurdle is $1,181.03, the SMA20, followed by $1,183.14, the SMA50. These are not just lines on a chart; they are areas where short-term traders often reassess whether a rally has real follow-through. Above that, the more important resistance is $1,280.34, near the upper edge of the recent range and below the $1,292.65 three-month high.
Technical Verdict: HOLD (wait & see)
- Reason 1: Price is still below the SMA20 and SMA50, and the chart has a death cross, which keeps the broader trend cautious.
- Reason 2: MACD remains negative with a bearish histogram, showing downside momentum is still active.
- Reason 3: Stochastic is oversold and price is near support, so the stock has bounce potential, but volume and OBV have not confirmed a reversal.
- Invalidation: This verdict is invalidated if price falls below $1,115.70, which would expose the $1,083.51 band and the $1,079.22 three-month low.
- Ideal Entry Range: $1,115.70 to $1,083.51
- Exit Target: $1,181.03 to $1,183.14
- Stop Loss Protection: Below $1,079.22
For non-traders, this means the stock is trying to stabilize, but the chart has not yet proven that the downtrend is over, and the next move depends on whether support at $1,115.70 holds. “We’re seeing a bounce, but not yet a change in character.”
Summary Data LLY
| Last price | 1,138.28 USD |
| Change 1 day / 5 days / 1 month | 2.02% / -0.96% / -3.55% |
| Trend / MA-cross | downtrend / death |
| SMA20 / SMA50 | 1,181.03 / 1,183.14 |
| RSI (14) / Stochastic %K | 42.5 / 16.5 |
| Bollinger %B / ATR | 28% / 28.28 |
| Support / Resistance 20 days | 1,115.70 / 1,280.34 |
| Data as of | 14 September 2026 20:30 WIB |



