CVX RSI Overbought: Stock Gains 2.64% (September 16, 2026)
On September 16, 2026: price 217.77 USD, trend uptrend, RSI 70.5, support 199.77, resistance 217.77. technical analysis of cvx stock. CVX RSI Overbought — full…

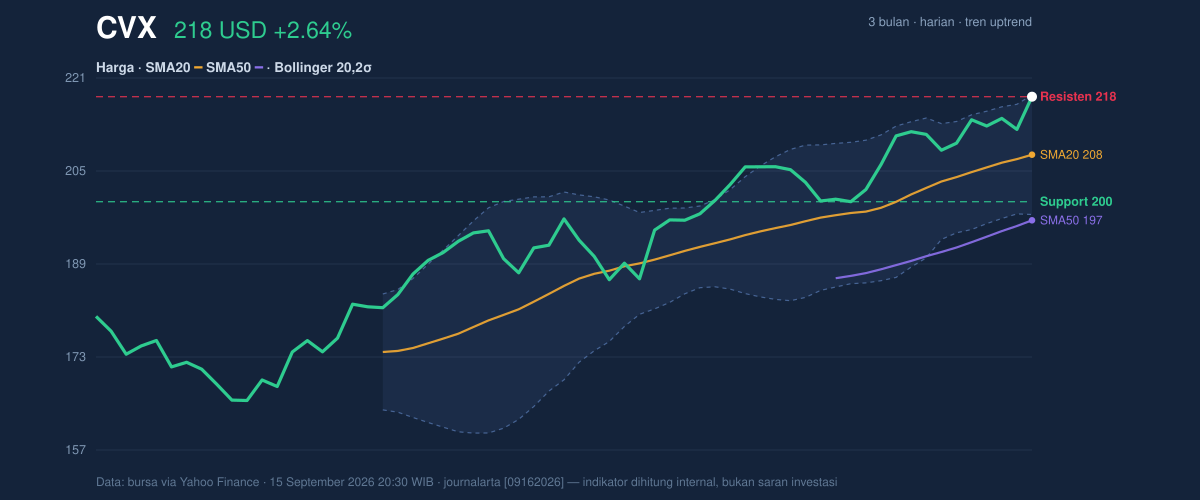
Chevron Corp. rose to 217.77 USD on the NYSE, up 2.64% from the previous close of 212.17, and the move lifted the stock to the very top of its recent trading band, with the 3-month high at 217.78 effectively in sight, according to data via Yahoo Finance as of 15 September 2026 20:30 WIB. The price is now trading above both the SMA20 at 207.83 and the SMA50 at 196.60, which tells traders the medium-term trend remains constructive. But the speed of the rise matters as much as the direction: momentum is strong, yet the stock is also pressing into stretched territory.
Trend & Price Action
The chart shows a stock that has been climbing with clear technical support underneath it. Chevron is above the SMA20, and that moving average itself is rising at 1.89% over the past 5 days, a sign that the short-term trend is still pointing higher rather than flattening out. The gap between the SMA20 and SMA50 also keeps the broader trend aligned upward, even though there is no new MA-cross to signal a fresh regime change. In plain terms, the stock is not just bouncing; it is trading in a sustained upward structure.
The price is also sitting at 100% of the 20-day range, with support at 199.77 and resistance at 217.77. That positioning is important because it shows the market has already priced in a strong run over the past month, where the stock gained 7.43%. When a name reaches the top of its range, the next move often depends less on trend direction and more on whether buyers can keep pushing after a strong burst.
Oscillators & Momentum
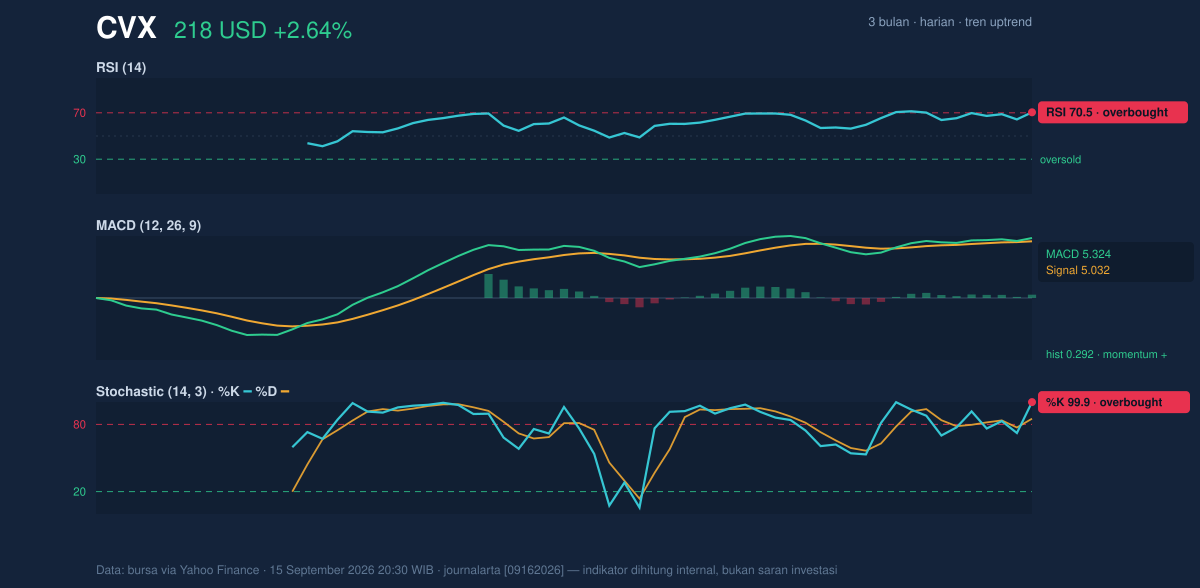
The momentum picture is powerful, but also increasingly extended. The RSI at 70.5 and Stochastic %K at 99.9 / %D at 85.1 both sit in overbought territory, which means the stock has risen fast enough that it may be vulnerable to a pause or a short consolidation. Overbought does not mean an immediate reversal; it means enthusiasm is high and the market may need fresh news or continued buying to avoid cooling off.
That said, the MACD at 5.324 remains above its signal line at 5.032, with a positive histogram of 0.292. This is the cleaner confirmation in the set: MACD is still saying upward momentum is intact, even as RSI and Stochastic warn that the move is becoming crowded. The chart therefore shows a split message — trend-following indicators remain supportive, while faster oscillators are flashing caution.
Volatility & Volume
Chevron’s Bollinger Bands help explain why the stock feels stretched without necessarily looking unstable. The upper band is 218.08, the middle band is the SMA20 at 207.83, and the lower band is 197.58. With %B at 98%, price is pressing almost all the way to the upper band, which usually signals strong upside pressure but also limited room before the market needs to either break out or cool off. The 9.9% band width is described as normal, so this is not a volatility squeeze that is about to explode; it is more a case of a healthy trend approaching the edge of its recent envelope.
Volume adds confirmation. The latest volume of 9,557,600 was about 1.2× the 20-day average of 7,890,340, and OBV is rising. OBV, or on-balance volume, is a cumulative measure of whether trading activity is flowing into the stock or out of it; a rising OBV alongside rising price suggests the move is being supported by participation rather than drifting on thin trade. The ATR at 4.49, equal to 2.1% of price, points to moderate daily movement — enough to matter, but not so wild that the chart is behaving erratically.
Key Levels & Scenarios
The immediate technical battleground is clear. Resistance at 217.77 is now being tested from below, while support at 199.77 remains the main floor if buyers step aside. Because the stock is already at the top of its range, the next meaningful signal is whether it can hold above the current high rather than simply touch it.
If Chevron can stay above 217.77 with continued volume support, the chart would begin to suggest a range expansion rather than just a one-day spike. If it fails to hold that level, the first area to watch is the SMA20 at 207.83, which often acts like a magnet in strong trends when price overheats. A deeper fade would bring 199.77 back into focus as the key structural support.
Technical Verdict: HOLD (wait & see)
HOLD (wait & see) fits the current setup best because the trend is still positive, but the stock is also technically stretched.
- MACD remains positive, showing the uptrend still has momentum behind it.
- RSI 70.5 and Stochastic 99.9/85.1 indicate overbought conditions, so upside may need a pause.
- Price at the upper Bollinger band and 217.77 resistance means the stock is testing a likely decision point.
Verdict invalidated if price falls below 199.77.
- Ideal Entry Range: 207.83 to 199.77
- Exit Target: 218.08
- Stop Loss protection: 197.58
In plain English: the chart still looks strong, but it is already running hot, so the next move matters more than the last one.
Summary Data CVX
| Last price | 217.77 USD |
| Change 1 day / 5 days / 1 month | 2.64% / 3.80% / 7.43% |
| Trend / MA-cross | uptrend / none |
| SMA20 / SMA50 | 207.83 / 196.60 |
| RSI (14) / Stochastic %K | 70.5 / 99.9 |
| Bollinger %B / ATR | 98% / 4.49 |
| Support / Resistance 20 days | 199.77 / 217.77 |
| Data as of | 15 September 2026 20:30 WIB |


