INTC Stock Gains 4.03% Today, Momentum Gains
On September 17, 2026: price 101.05 USD, trend sideways, RSI 54.7, support 87.26, resistance 106.24. technical analysis of intc stock. INTC Stock Gains — full…

Intel’s shares are back above their short-term average, but the market is still treating the move as a test rather than a verdict. On NASDAQ, INTC last traded at 101.05 USD, up 4.03% on the day, after a weaker -4.89% five-day stretch and a modest 4.51% gain over one month.
Trend & Price Action
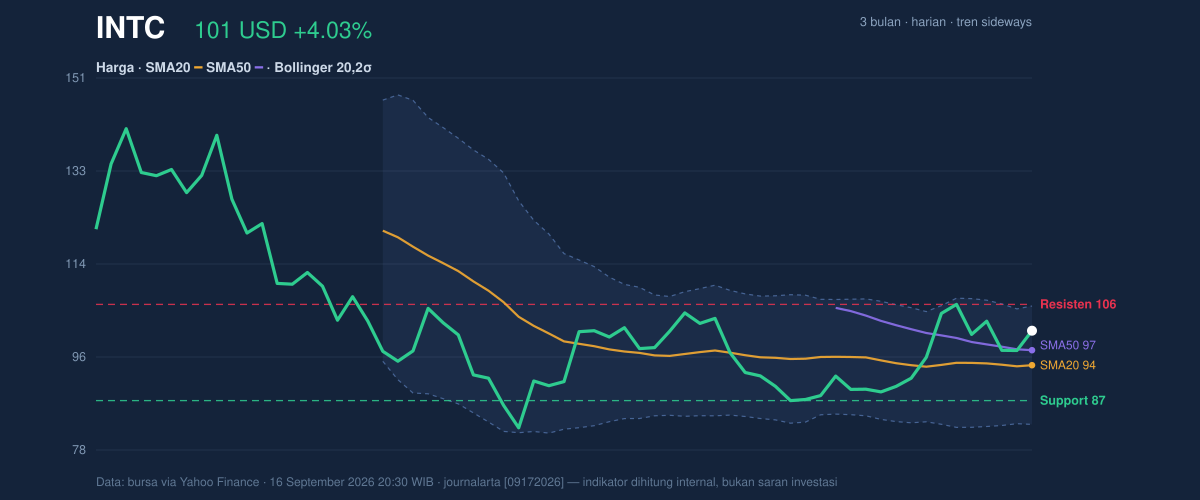
The stock is still best described as sideways, even though the latest bounce has improved the tone. That matters because a sideways trend usually means the market has not yet committed to a sustained direction; traders are still weighing whether recent strength is a breakout attempt or just another move inside a broad range.
What gives the rally some credibility is that price now sits above the SMA20 at 94.24 and also above the SMA50 at 97.20. In plain English, the short-term price is trading above both the near-term and medium-term trend lines, which often signals that sellers have lost some control. But the slope of the SMA20 is still -0.50% over five days, so the average itself is not yet turning decisively upward. That is the key nuance: the stock is improving faster than the trend measure that tracks it.
The chart also shows no fresh moving-average cross, which reduces the chance of calling this a clean trend reversal. Instead, it looks like a market trying to build a base after a long swing. The three-month high of 142.35 and three-month low of 81.79 frame that base-building process: INTC is well above the low, but still far from the top of the range, so the rebound remains incomplete.
Oscillators & Momentum
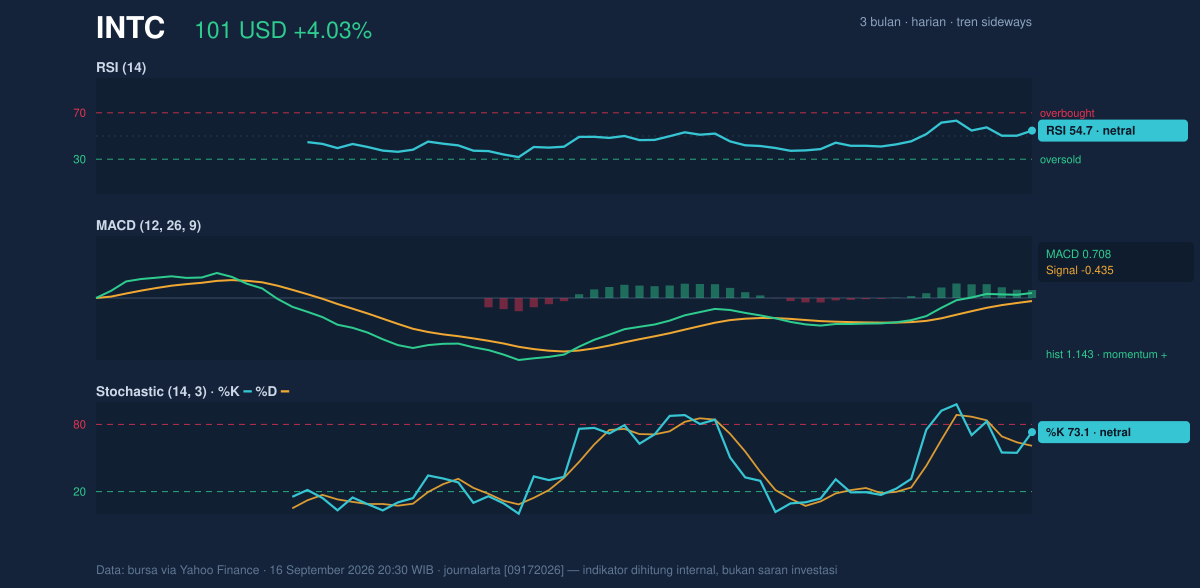
The momentum picture is better than the trend picture, and that split is important. RSI(14) at 54.7 is neutral, which means the stock is not stretched enough to suggest an overbought condition, but also not weak enough to imply exhaustion on the downside. Neutral RSI often reflects a market that is still deciding whether the latest move deserves follow-through.
The stochastic reading is a little firmer. Stochastic %K at 73.1 and %D at 60.9 shows momentum leaning upward, though not in a way that screams runaway strength. Read together, these figures suggest the stock is pressing higher, but not at a pace that would normally trigger concern about overheating. That is consistent with a rebound that still needs confirmation from price follow-through.
The strongest signal in this section is the MACD. MACD at 0.708, with the signal line at -0.435 and a histogram of 1.143, points to positive momentum that is improving rather than fading. For general readers, MACD is a trend-following gauge: when it sits above the signal line and the gap is positive, it usually means buying pressure is stronger than selling pressure. That is the clearest technical argument that the recent bounce is more than a one-day reaction.
Volatility & Volume
This is not a quiet chart. The Bollinger Bands are widening, with the upper band at 105.93, the middle band at 94.24, and the lower band at 82.55. A wider band typically means the stock has entered a higher-volatility phase, where larger daily moves become more likely. That matters because direction can accelerate quickly once price approaches either edge of the range.
The current price is sitting at %B 79%, which places it in the upper part of the Bollinger envelope but not yet at the extreme top. In practical terms, INTC is closer to the upper band than the lower one, which supports the idea of a constructive rebound, though not necessarily a breakout already confirmed.
Volume adds another layer of support. The latest turnover was 119,111,400 shares versus a 20-session average of 91,436,415, or about 1.3× normal. That is meaningful because a price move backed by above-average volume is usually more credible than one made on thin participation. The fact that OBV is rising reinforces that point: on-balance volume tracks whether trading flow is accumulating or distributing, and a rising line suggests buyers are doing enough business to matter.
ATR is also elevated at 5.24, or 5.2% of price. That is a direct warning that the stock can move sharply in either direction. In a high-ATR environment, support and resistance matter more than usual because the stock can travel through levels quickly.
Key Levels & Scenarios
The nearest reference points are clear. Support sits at 87.26, while resistance is at 106.24. The stock is currently at 101.05, which places it around 73% of the 20-session range. That positioning is constructive, but it also means the chart is already close enough to resistance that upside needs confirmation, not assumption.
The Bollinger upper band at 105.93 sits just below resistance, which creates a tight test zone. If the shares can hold above the upper-90s and push through the 106.24 resistance, the chart would begin to look more like a continuation move than a simple rebound. If instead price slips back below 97.20, the SMA50 would turn into a warning line, because it would suggest the latest recovery has failed to hold the medium-term trend. A deeper loss of 94.24 would weaken the short-term structure further and bring the lower Bollinger band into focus.
Technical Verdict: HOLD (wait & see)
HOLD (wait & see)
- MACD is positive and the histogram is strong, which supports improving momentum.
- Price is above SMA20 and SMA50, but the SMA20 slope is still negative, so trend confirmation is incomplete.
- Volume is 1.3× normal and OBV is rising, which supports participation, but price is still below the key 106.24 resistance.
Verdict invalidated if price falls below 87.26, the nearest 20-session support.
- Ideal Entry Range: 97.20 to 101.05
- Exit Target: 105.93 to 106.24
- Stop Loss protection: 87.26
In plain English: the chart is improving, but it has not yet proved that the rebound can turn into a cleaner trend.
Summary Data INTC
| Last price | 101.05 USD |
| Change 1 day / 5 days / 1 month | 4.03% / -4.89% / 4.51% |
| Trend / MA-cross | sideways / none |
| SMA20 / SMA50 | 94.24 / 97.20 |
| RSI (14) / Stochastic %K | 54.7 / 73.1 |
| Bollinger %B / ATR | 79% / 5.24 |
| Support / Resistance 20 days | 87.26 / 106.24 |
| Data as of | 16 September 2026 20:30 WIB |


