META RSI Overbought: Stock Gains 11.34% (September 22, 2026)
On September 22, 2026: price 741.25 USD, trend uptrend, RSI 78.0, support 559.02, resistance 741.25. technical analysis of meta stock. META RSI Overbought —…

Meta Platforms jumped to 741.25 USD by 21 September 2026 20:30 WIB, a move that leaves the stock sitting at the top of its recent trading range and just below its 3-month high of 753.00. The scale of the rise matters as much as the number itself: the shares are now 11.34% higher on the day, up 34.80% over one month, and trading well above both major moving averages. That combination tells investors the market is not merely reacting to a one-off burst of enthusiasm; it is pricing in a trend that has strengthened quickly, with technical momentum still in control even as some warning lights are flashing.
Trend & Price Action
The broader structure remains decisively bullish. Meta is in an uptrend, with the SMA20 at 624.18 above the SMA50 at 608.82, and the chart shows a golden cross, where the shorter average has moved above the longer one. In plain terms, that is a classic sign that recent buying pressure has overtaken the slower trend. It often attracts trend-following flows, especially when the slope of the short average is rising, as it is here at 5.75% over 5 days. The stock is also trading above the upper Bollinger band, with the band top at 721.59, which signals the move has stretched beyond its recent statistical envelope rather than simply drifting upward inside it.
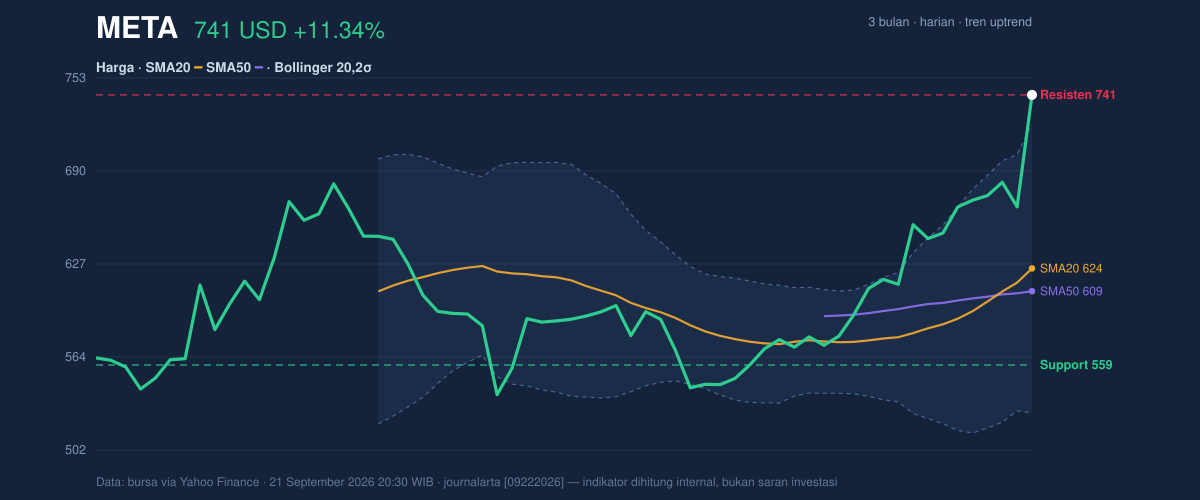
That matters because prices outside the upper band can mean two very different things: either a strong breakout is under way, or the move has become extended and vulnerable to profit-taking. Meta’s position at 100% of its 20-hour range and near the 3-month high of 753.00 suggests the market is pressing against resistance rather than consolidating beneath it. The nearest support level in the data sits at 559.02, which is far below the current price and shows how far the stock has traveled in a short span. The distance itself is a signal: the rally has been powerful, but the cushion beneath it is now thinner in the sense that much of the move has already happened.
Oscillators & Momentum
The momentum gauges are aligned, but they are also telling a story of maturity rather than freshness. RSI at 78.0 and Stochastic %K at 94.0 / %D at 91.2 both sit in overbought territory. For general readers, that does not mean the stock must fall immediately; it means buying has been so strong that the price may be running ahead of short-term equilibrium. In strong trends, overbought readings can persist. But when they appear alongside a sharp extension above the Bollinger band, they usually warn that upside may become more selective from here.
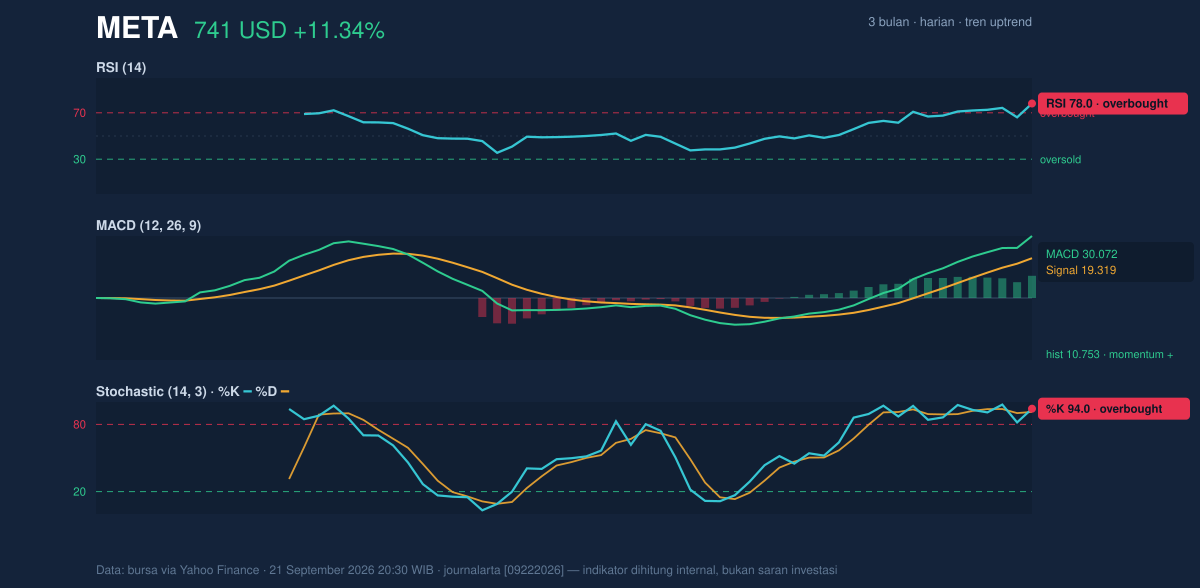
The MACD picture is more supportive. MACD at 30.072 is above its signal line at 19.319, with a histogram of 10.753. That configuration means upward momentum is still expanding rather than fading, and it helps explain why the stock has been able to hold such a steep climb. The tension is clear: momentum is positive, but oscillators are stretched. In technical terms, Meta is not showing a breakdown in trend; it is showing a trend that may be entering an overextended phase.
Volatility & Volume
Volatility is not just elevated; it is expanding. The Bollinger band width of 31.2% points to a wider trading envelope than before, and the ATR of 27.34, equal to 3.7% of price, confirms that daily swings are large enough to matter. That is important because a strong trend with high ATR can produce fast continuation moves, but it can also punish late entries with abrupt reversals. The current price at %B 110% means Meta is trading above the top of the Bollinger range, a sign of force, but also of extension.
Volume adds credibility to the move. Last volume came in at 48,572,800, about 2.4× the 20-hour average of 20,414,695, while OBV is rising. That combination suggests the rally is being supported by real participation rather than thin trading. When volume surges alongside price and OBV rises, it often means institutions and larger participants are not standing aside. The move is therefore better supported than a low-volume spike would be, even if the overbought readings argue for caution.
Key Levels & Scenarios
The nearest reference point in the data is the 741.25 resistance, which is also the latest price, meaning the stock is testing the top of its current structure right now. Above that, the next obvious marker is the 3-month high at 753.00. A clean move through that area would reinforce the idea that the breakout is continuing rather than stalling. If the stock fails to hold this zone, the first place traders will look for a reset is the area around the upper Bollinger band at 721.59, where momentum would still be strong but less stretched.
The deeper structural support remains the SMA20 at 624.18, with the SMA50 at 608.82 below it. Those averages matter because they show where the trend would start to look less convincing if price were to retreat. The support at 559.02 is the lower boundary from the 20-hour range and marks a much more severe downside reference if the rally unwinds sharply. Given the current configuration, the market is still in control of the upside, but it is doing so from a stretched position.
Technical Verdict: HOLD (wait & see)
HOLD (wait & see)
- MACD remains positive, with the line above the signal and a solid histogram, so trend momentum is still intact.
- RSI 78.0 and Stochastic 94.0 / 91.2 show the stock is overbought, which raises the odds of consolidation or a pause.
- Price above the upper Bollinger band and a 2.4× volume surge confirm strength, but also indicate the move is extended and vulnerable to near-term cooling.
Verdict invalidated if price falls below 721.59, because that would mean the stock has slipped back inside the Bollinger envelope and lost part of the breakout’s urgency.
- Ideal Entry Range: 721.59 to 741.25
- Exit Target: 753.00
- Stop Loss protection: 624.18
For non-traders, this means Meta is still strong, but it is already trading in the part of the move where the risk of a pause is rising. “The trend is powerful, but the stock is now asking the market to prove it can keep going.”
Summary Data META
| Last price | 741.25 USD |
| Change 1 day / 5 days / 1 month | 11.34% / 11.36% / 34.80% |
| Trend / MA-cross | uptrend / golden |
| SMA20 / SMA50 | 624.18 / 608.82 |
| RSI (14) / Stochastic %K | 78.0 / 94.0 |
| Bollinger %B / ATR | 110% / 27.34 |
| Support / Resistance 20 days | 559.02 / 741.25 |
| Data as of | 21 September 2026 20:30 WIB |



