Momentum Gains, AMAT Stock Gains 4.42% Today
On September 22, 2026: price 464.24 USD, trend sideways, RSI 49.3, support 415.38, resistance 484.19. technical analysis of amat stock.

Applied Materials is trading higher in a market that is still trying to decide whether the recent bounce is a pause inside a wider downtrend or the start of a more durable recovery. The shares finished at 464.24, up 4.42% on the day and 9.44% over five days, but still down 5.70% over one month, a mix that points to short-term relief rather than a clean trend change.
Trend & Price Action
The stock is sitting above the 20-day average at 452.82 but below the 50-day average at 498.35, which is an important split for readers watching the broader structure. In plain terms, the shorter-term tape has improved, yet the longer trend has not been reclaimed. That is why the chart still reads as sideways, not decisively bullish, even after the latest rebound.
The slope of SMA20 at -3.94% over five days shows the recent average is still drifting lower, so the bounce is happening against a mildly negative backdrop. The market has also not produced a fresh moving-average crossover, which matters because crossovers often mark a shift in trend leadership; without one, the move is better read as a recovery inside a range. As shown in the chart, the price is now closer to the upper half of the recent band, but not yet at the point where resistance has clearly given way.
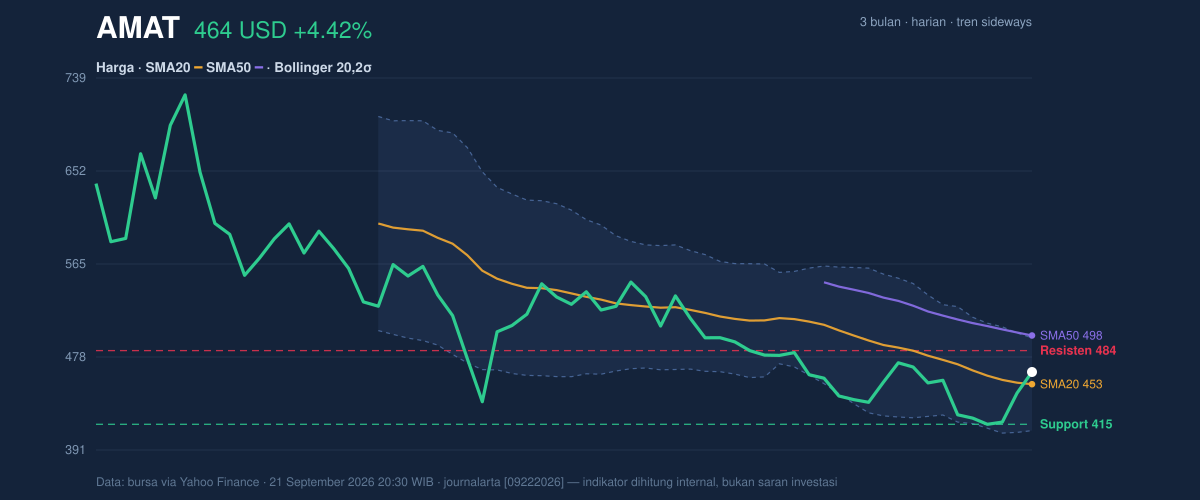
Within the 20-hour support at 415.38 and 20-hour resistance at 484.19, the shares are trading at about 71% of the range. That placement says buyers have regained control of the upper half of the corridor, but they have not yet forced a breakout. The broader three-month range reinforces the point: the stock is far below the 3-month high of 739.67 and only modestly above the 3-month low of 411.51, so the recovery remains partial rather than complete.
Oscillators & Momentum
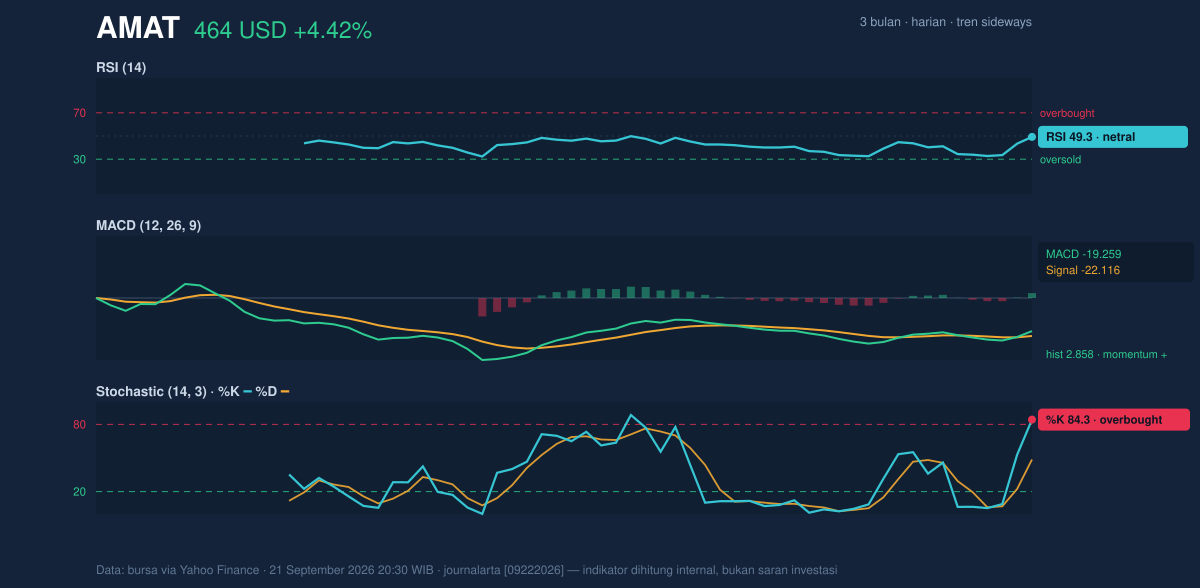
The momentum picture is more constructive than the trend picture. RSI at 49.3 is neutral, which means the stock is neither stretched nor washed out. That is useful because it leaves room for further upside without immediately signaling exhaustion. But the more interesting signal comes from stochastics: Stochastic %K at 84.3 versus %D at 48.7 shows the short-term move has accelerated into overbought territory. In simple terms, the recent advance has been fast enough that traders may start locking in gains, even if the larger move has not fully run its course.
The MACD setup is still supportive. MACD at -19.259 sits above the signal line at -22.116, and the histogram at 2.858 is positive. That combination means downside momentum has eased and the stock is building upward pressure, even though the MACD remains below zero and has not fully flipped into a bullish trend regime. As shown in the chart, this is the kind of signal that often appears early in a recovery: improving momentum first, trend confirmation later.
Volatility & Volume
Volatility is not subdued here. ATR(14) at 18.61, or 4.0% of price, says daily swings are still wide enough to matter. That usually means the next move can travel quickly once a level breaks, but it also raises the risk of false starts. The Bollinger Bands help frame that risk: price is above the middle band at 452.82, with the upper band at 496.17 and lower band at 409.48. The %B at 63% places the stock above the midpoint of the band structure but still short of the upper edge, while the 19.1% band width suggests a normal volatility regime rather than a squeeze. That matters because the market is not compressed; it already has room to move, and the move is being decided by participation rather than by an imminent volatility release.
Participation is improving. Volume reached 9,478,700, versus a 20-day average of 6,679,880, or about 1.4× normal. Rising volume on a rebound is usually more credible than a low-volume bounce because it shows institutions and larger traders are engaged. The fact that OBV is rising strengthens that interpretation: on-balance volume tracks whether money is flowing into or out of the stock, and a rising line suggests accumulation is outpacing distribution.
Key Levels & Scenarios
The immediate map is fairly clear. 484.19 is the first level that matters on the upside, because it is the current resistance ceiling and sits just below the upper Bollinger band at 496.17. A move through that zone would tell the market the bounce is no longer just a retracement inside a range. Below, 452.82 is the first technical reference because it is both the 20-day average and the Bollinger midline; losing it would weaken the current recovery. Deeper support sits at 415.38, and that is the level that would test whether the stock is still holding its broader base near the lower end of the three-month range.
If price clears 484.19 with volume still above average, the chart would likely shift from recovery mode toward a more durable breakout attempt. If it slips back below 452.82, the recent rally starts to look more like a countertrend move. If it falls through 415.38, the market would be signaling that the recent stabilization has failed.
Technical Verdict: HOLD (wait & see)
HOLD (wait & see)
- MACD is improving, with the histogram positive, which supports the rebound.
- Price is above SMA20 and volume is 1.4× normal, showing buyers are participating.
- Stochastic is overbought and price is still below SMA50, so the move is not yet confirmed as a full trend reversal.
Verdict invalidated if price breaks 415.38.
- Ideal entry range: 452.82 to 464.24
- Exit target: 484.19 to 496.17
- Stop loss protection: 415.38
In plain English: the stock has recovered, but it still needs to prove that the bounce can survive the next test at resistance. “We’re seeing strength, but not yet proof.”
Summary Data AMAT
| Last price | 464.24 USD |
| Change 1 day / 5 days / 1 month | 4.42% / 9.44% / -5.70% |
| Trend / MA-cross | sideways / none |
| SMA20 / SMA50 | 452.82 / 498.35 |
| RSI (14) / Stochastic %K | 49.3 / 84.3 |
| Bollinger %B / ATR | 63% / 18.61 |
| Support / Resistance 20 days | 415.38 / 484.19 |
| Data as of | 21 September 2026 20:30 WIB |



