RSI Overbought, AMD Stock Gains 9.95% Today
On September 22, 2026: price 615.52 USD, trend uptrend, RSI 72.8, support 456.16, resistance 615.52. technical analysis of amd stock. RSI Overbought — full…

AMD is pressing against the top of its recent trading range, and for international investors that matters because the move is no longer just about earnings optimism — it is now testing how much enthusiasm the market can sustain.
Advanced Micro Devices closed at 615.52 USD, up 9.95% on the day, after a strong 24.75% gain over five days and a 30.06% rise over one month, according to market data from Yahoo Finance. That is a sharp acceleration, and the signal is not simply that AMD is rising; it is that buyers have been willing to pay progressively higher prices even as the stock reaches the edge of its recent ceiling. The question now is whether that kind of momentum is being confirmed by underlying trend indicators, or whether it is starting to look stretched.
Trend & Price Action
The broader structure remains constructive. AMD is in an uptrend, with the SMA20 at 497.87 sitting above the SMA50 at 497.00, and the chart shows a golden cross, meaning the shorter average has moved above the longer one. In plain terms, that usually signals that recent buying pressure is strong enough to overtake the slower-moving trend, a classic sign that the market is leaning bullish.
Price is also trading above the SMA20, which tells us the stock is not merely recovering but holding above the short-term trend line. More importantly, it is sitting at the very top of its 20-hour support/resistance range, with support at 456.16 and resistance at 615.52. As shown in the chart, AMD is effectively at 100% of the range, which means there is little room left inside the current band before the market must either break into new territory or pause to digest gains.
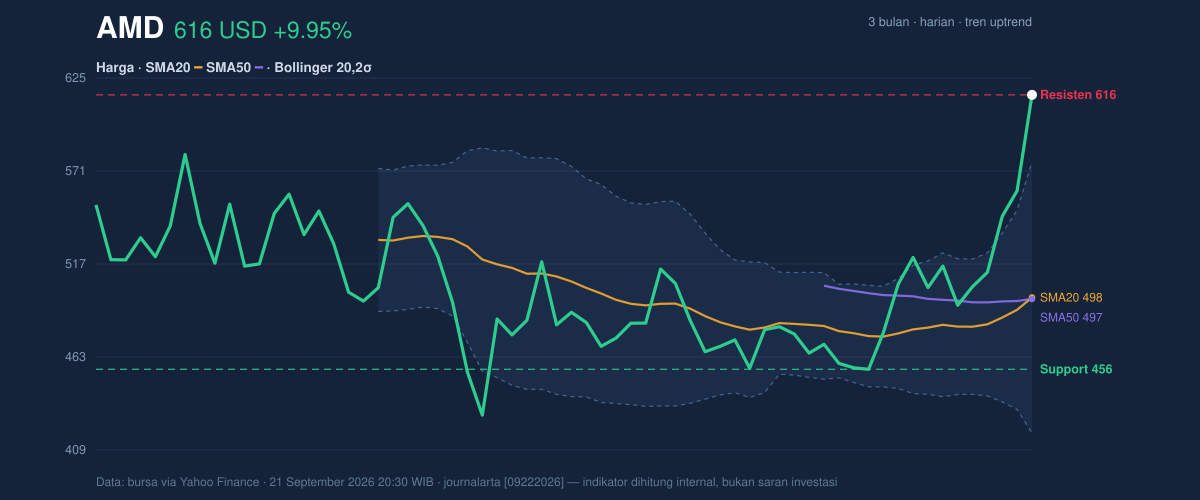
The 3-month high is 616.69, and the stock’s last print of 615.52 leaves it just below that mark. That proximity matters: when a stock is hugging a fresh high after a fast run, traders are watching for either a clean breakout or a rejection that turns the high into a near-term ceiling.
Oscillators & Momentum
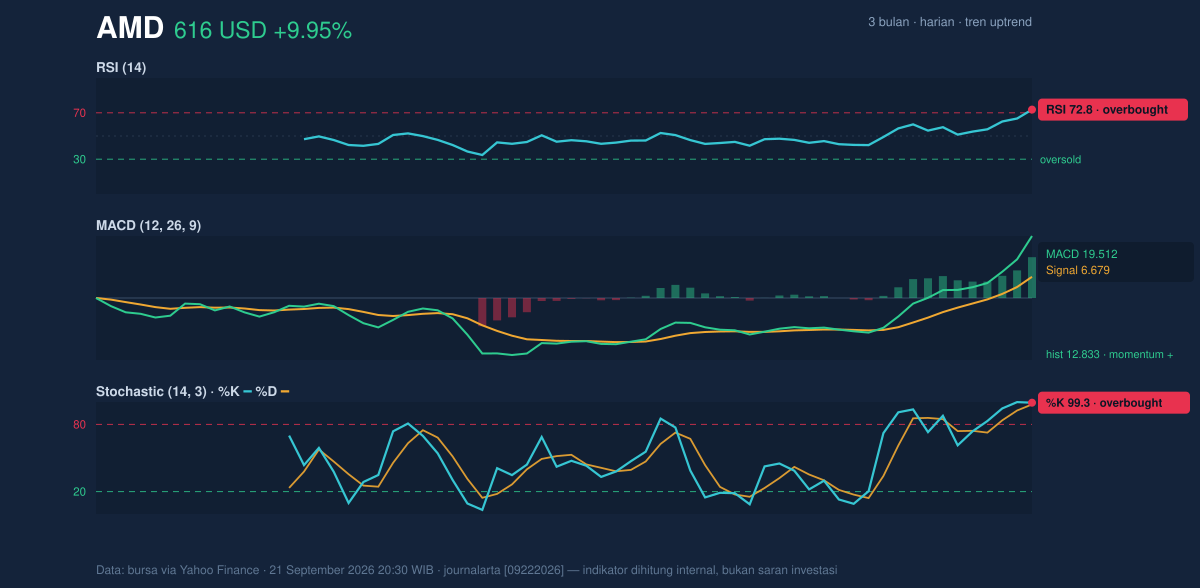
Momentum is strong, but it is also stretched. The RSI(14) at 72.8 and the Stochastic %K at 99.3 / %D at 97.9 both sit in overbought territory. For general readers, that does not mean the stock must fall immediately; it means the pace of buying has been intense enough that the market may be vulnerable to a pause or pullback if fresh demand slows.
That tension is important because the MACD at 19.512, above its signal line at 6.679, with a histogram of 12.833, still points to positive momentum. In other words, the trend is not weakening yet. The MACD is saying the rally still has force, while RSI and Stochastic are warning that the move has become extended. When those signals diverge, the market is usually in a strong trend phase but close to a point where traders begin locking in gains.
Volatility & Volume
Volatility is elevated and expanding. The Bollinger Bands show an upper band at 576.59, a middle band at 497.87, and a lower band at 419.14, with %B at 125% and band width at 31.6%. A %B reading above 100% means price is trading beyond the upper band, which is often a sign of momentum strength, but also of short-term overheating. The widening band structure suggests the market is not settling down; it is moving with force.
The ATR(14) at 25.52, equal to 4.1% of price, confirms that day-to-day swings are likely to remain large. That is reinforced by volume: the latest session traded 44,270,000 shares versus a 20-day average of 20,557,160, or about 2.2× normal. Rising volume alongside a rising price is usually a sign of participation rather than a thin, fragile move. The OBV is rising, which supports the idea that money flow has been backing the advance rather than fading it.
Key Levels & Scenarios
The nearest reference point is the 3-month high of 616.69. If AMD can move decisively above that level, the chart would be entering price discovery, where there is no nearby overhead supply from recent trading. If it fails there, the most relevant first area to watch is the Bollinger middle band at 497.87, which also aligns with both the SMA20 and SMA50. That confluence makes it an important pivot: it is where the market would likely have to prove the trend is still intact after any pullback.
The lower boundary that matters most is 456.16, the current support in the 20-hour range. A break below that would suggest the recent surge has lost traction and that the market is moving back into the middle of its broader band structure.
Technical Verdict: HOLD (wait & see)
HOLD (wait & see)
- MACD remains positive, which supports the trend and shows the rally still has underlying momentum.
- RSI at 72.8 and Stochastic near 100 indicate the stock is overbought, so the move is strong but stretched.
- Price is at 100% of the recent range and just below the 3-month high of 616.69, leaving limited room before a breakout or pullback decision is made.
Verdict invalidated if price falls below 456.16.
- Ideal Entry Range: 497.87 to 456.16, where the chart would be closer to the SMA20/SMA50 and the middle of the Bollinger structure.
- Exit Target: 616.69, the 3-month high and nearest breakout threshold.
- Stop Loss protection: 456.16, the current support level in the 20-hour range.
For non-traders, this means AMD still looks strong, but after such a fast climb, the market is waiting to see whether the next move is a breakout or a breather.
“Right now the chart is still shouting strength, but it is also close to the point where strength has to prove itself.”
Summary Data AMD
| Last price | 615.52 USD |
| Change 1 day / 5 days / 1 month | 9.95% / 24.75% / 30.06% |
| Trend / MA-cross | uptrend / golden |
| SMA20 / SMA50 | 497.87 / 497.00 |
| RSI (14) / Stochastic %K | 72.8 / 99.3 |
| Bollinger %B / ATR | 125% / 25.52 |
| Support / Resistance 20 days | 456.16 / 615.52 |
| Data as of | 21 September 2026 20:30 WIB |



