META Stock Gains 1.02%, RSI Overbought In Focus
On September 24, 2026: price 744.10 USD, trend uptrend, RSI 77.1, support 571.10, resistance 744.10. technical analysis of meta stock. META Stock Gains — full…

Meta Platforms closed at 744.10 USD on 23 September 2026, up 1.02% on the day and 30.53% over the past month, with the stock now pressing against the top of its recent trading range, according to Yahoo Finance data. The message from the tape is clear: buyers remain in control, but the move is stretched. The share price sits well above both the SMA20 at 641.76 and the SMA50 at 612.08, while a golden cross has formed as the shorter average moved above the longer one. That pattern usually signals that medium-term momentum has turned decisively upward, yet the same chart also shows the stock at 100% of its 20-hour range and only a short distance from the 3-month high of 763.90. In plain terms, Meta is trending strongly, but it is also running hot.
Trend & Price Action
The broader structure remains constructive. The uptrend is backed by a rising SMA20 slope of 6.64% over 5 days, which means the short-term trend is still accelerating rather than flattening out. That matters because a steepening moving average often reflects persistent demand, not just a one-day burst. Meta’s price being above both moving averages also tells investors that recent gains have not merely retraced a decline; they have built on a trend that is already established. As shown in the chart, the stock is trading close to the upper Bollinger band, which reinforces the idea that momentum is strong but leaves less room for error if enthusiasm cools.
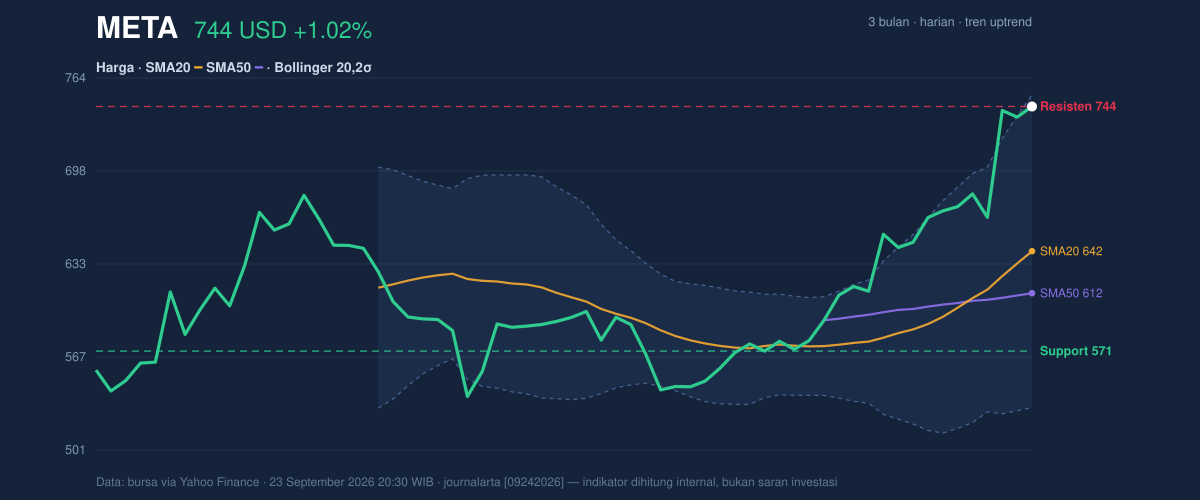
The key tension now is location. The stock is sitting at 744.10, just below the Bollinger upper band at 752.31, and that positioning usually signals an extended advance rather than a comfortable base. The 20-hour support at 571.10 is far below current levels, so the market has already repriced Meta sharply higher. That does not invalidate the trend; it simply means fresh upside would need to come from continued conviction rather than a bargain-hunting setup.
Oscillators & Momentum
Momentum indicators are still positive, but they are also warning that the rally may be overbought. The RSI at 77.1 is in overbought territory, and the Stochastic %K at 87.6 with %D at 90.1 says the stock has been closing near the top of its recent range. For general readers, that usually means the pace of buying has been strong enough to leave the stock vulnerable to pauses or shallow pullbacks, even if the larger trend remains intact. In other words, overbought does not mean the trend is broken; it means the trend may need to breathe.
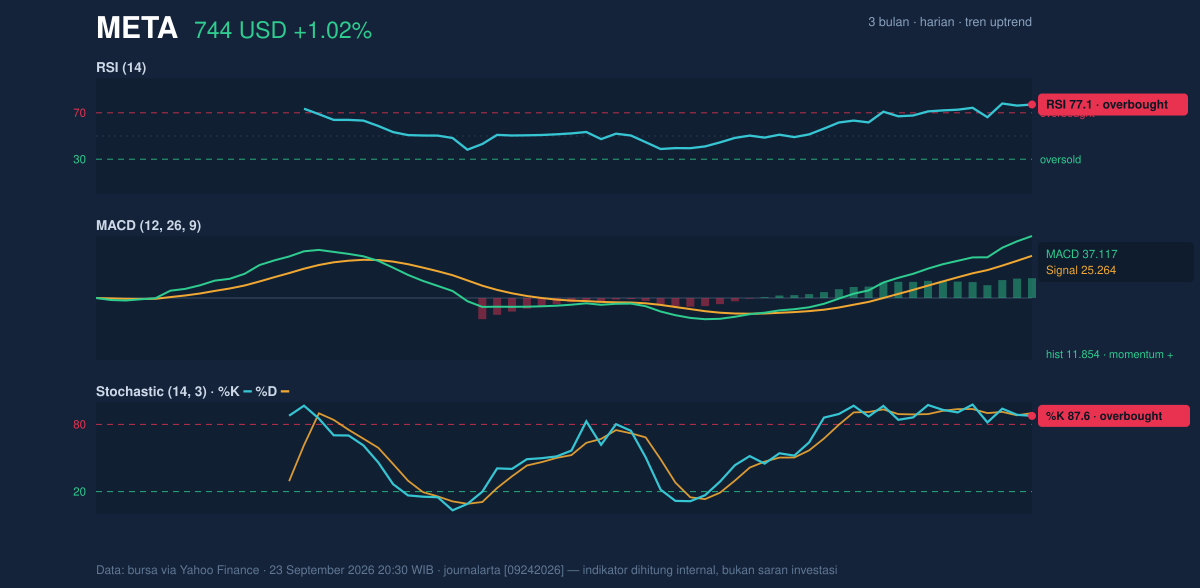
The MACD at 37.117, above its signal line at 25.264, still supports the bullish case because it shows trend momentum remains positive. The 11.854 histogram confirms that the gap between the MACD line and the signal line is still in favor of buyers. But when strong MACD momentum is paired with overbought RSI and Stochastic readings, the signal is less about immediate reversal and more about a market that has already moved a long way, quickly. That combination often produces choppy trading rather than a smooth climb.
Volatility & Volume
Volatility is elevated. The ATR at 27.51, equal to 3.7% of price, indicates that daily swings are large enough to matter even for a megacap stock. The Bollinger bands are also widening, with a 34.5% band width, which suggests the market is pricing in a broader range of outcomes. When bands expand after a strong move, it usually means the stock is not settling into a quiet phase; it is still in an active trend, with the potential for sharp continuation or equally sharp mean reversion.
Volume adds a useful layer of confirmation. Last volume was 30,346,000, about 1.4x the 20-hour average of 22,207,500, while OBV is rising. That combination matters because price gains supported by heavier trading and a rising on-balance volume line suggest the advance is being broadly participated in, not driven by a thin order book. As shown in the chart, the market is not merely drifting higher; it is attracting active involvement.
Key Levels & Scenarios
The nearest reference points are tight at the top of the range. The 20-hour resistance at 744.10 has effectively been tested, while the Bollinger upper band at 752.31 and the 3-month high at 763.90 stand as the next visible markers above. On the downside, the SMA20 at 641.76 is the first major technical cushion, with the SMA50 at 612.08 beneath it. If the stock can hold above the moving averages and absorb overbought conditions without losing momentum, the chart stays constructive. If it fails to hold the recent breakout zone and slips back toward the mid-band, that would suggest the rally is pausing rather than extending.
Technical Verdict: HOLD (wait & see)
HOLD (wait & see) because the trend remains strong, but the setup is extended and overbought.
- RSI at 77.1 and Stochastic at 87.6/90.1 show stretched momentum, which raises the risk of a near-term pause.
- MACD above signal and OBV rising confirm the uptrend is still supported by participation.
- Price above SMA20 and SMA50, plus a golden cross, keeps the medium-term structure bullish.
Verdict invalidated if price breaks below 641.76, because that would put the stock back under the SMA20 and weaken the current trend structure.
- Ideal Entry Range: 641.76 to 671.00, using the SMA20 as the main technical reference and allowing some room above it.
- Exit Target: 752.31 to 763.90, aligned with the Bollinger upper band and the 3-month high.
- Stop Loss protection: below 612.08, where the SMA50 would signal the trend is losing its medium-term base.
In plain English: Meta still looks strong, but after a fast run, the chart is saying “wait for a better setup” rather than “chase it here.”
Summary Data META
| Last price | 744.10 USD |
| Change 1 day / 5 days / 1 month | 1.02% / 10.51% / 30.53% |
| Trend / MA-cross | uptrend / golden |
| SMA20 / SMA50 | 641.76 / 612.08 |
| RSI (14) / Stochastic %K | 77.1 / 87.6 |
| Bollinger %B / ATR | 96% / 27.51 |
| Support / Resistance 20 days | 571.10 / 744.10 |
| Data as of | 23 September 2026 20:30 WIB |

