PANW Stock Technicals Today: Gains 5.79%, Testing Key Resistance
On September 24, 2026: price 393.30 USD, trend uptrend, RSI 62.5, support 328.48, resistance 393.30. technical analysis of panw stock. PANW Stock Technicals —…

Palo Alto Networks rose to 393.30 on Nasdaq, up 5.79% from the previous close of 371.76, after the stock pushed right up to the top of its recent trading band. That move matters because it came with the price already sitting above both short- and medium-term trend lines, even as some momentum gauges now look stretched.
Trend & Price Action
The chart shows a stock that is still in an uptrend, with the SMA20 at 357.06 and the SMA50 at 354.96, and price holding above the SMA20. That alignment tells us the market has not only recovered its short-term average, but is also trading above the broader recent trend baseline. The lack of a new MA-cross means this is not a fresh moving-average breakout story; instead, it is a continuation move, where the existing trend is being extended rather than newly confirmed.
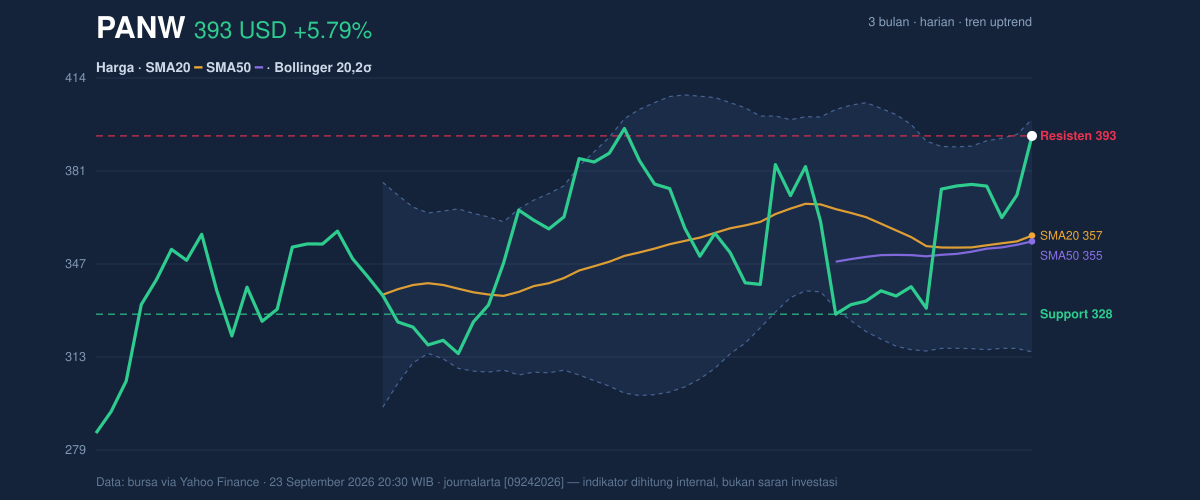
What stands out is positioning. At 393.30, PANW is sitting at the top of the 20-hour range and only a little below the 3-month high of 398.88. In plain terms, the stock is no longer in the middle of a consolidation zone; it is testing the upper edge of the recent price structure. That usually signals confidence, but it also means upside attempts can become harder to sustain without fresh buying.
The nearest reference on the downside is the 20-hour support at 328.48. That is a wide gap from the current price, which reinforces how strongly the stock has already run. It also means any pullback would still have room to stay technically constructive before the trend is damaged.
Oscillators & Momentum
Momentum is mixed, and that mix is important. The RSI at 62.5 is still described as neutral, which means the stock is not yet in a classic overbought zone by that measure. But the Stochastic %K at 99.7 and %D at 83.0 are both signaling overbought conditions. As shown in the chart, that combination usually means the stock has moved quickly enough that short-term traders may already be crowded on the same side of the trade.
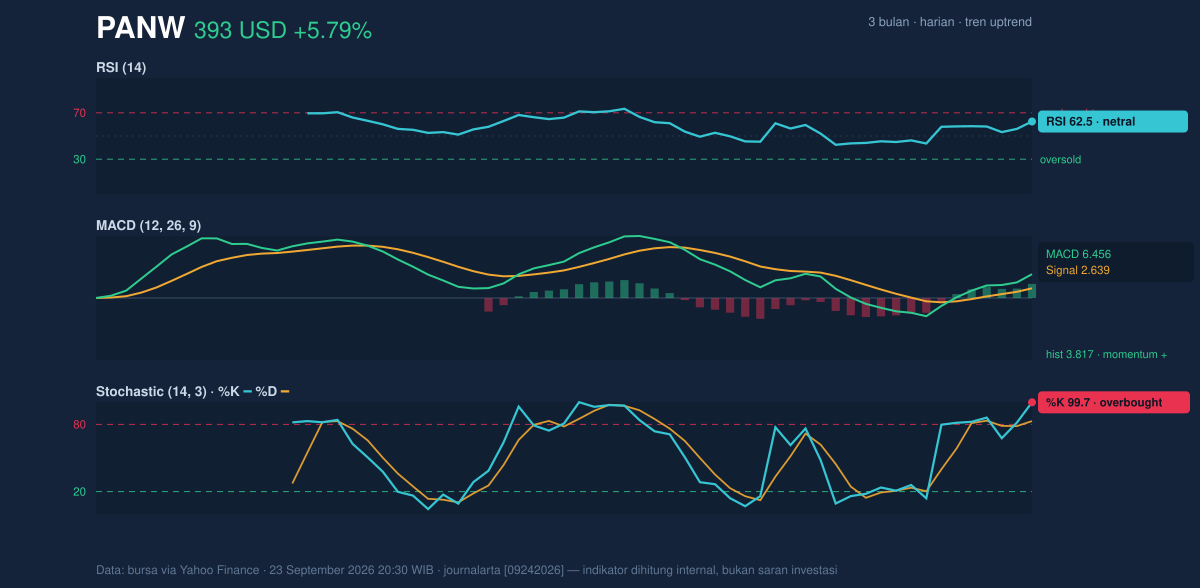
The MACD at 6.456, above its signal line at 2.639, with a positive histogram of 3.817, still points to positive momentum. The signal here is that trend strength remains intact even if the pace may be getting ahead of itself. In other words, the trend is still healthy, but the oscillator setup warns that the next leg higher may need a pause or consolidation first.
That tension between positive MACD momentum and overbought Stochastic readings is often what traders see near local highs: the bigger trend is up, but the stock may be vulnerable to a brief cooling-off period before it can extend further.
Volatility & Volume
Volatility is elevated. The Bollinger Bands show the upper band at 399.33, the middle band at 357.06, and the lower band at 314.79. With %B at 93%, PANW is trading very close to the top of its band structure, which means price is pressing into an area where it has historically been relatively stretched. The 23.7% band width confirms that volatility has expanded, not contracted. A widening band often means the market is preparing for a larger move, but it does not say direction on its own.
The ATR(14) at 19.36, equal to 4.9% of price, reinforces that message. This is a stock that can move meaningfully in a session, so a near-record position in the band with a high ATR suggests swings can be sharp in both directions.
Volume, however, is less emphatic than price. The latest volume of 6,272,700 is below the 20-hour average of 7,083,710, or about 0.9× normal. That matters because a move toward resistance is usually more convincing when participation is expanding. The fact that OBV is rising helps offset that concern somewhat: on-balance volume suggests money flow has still been leaning in the direction of accumulation, even if the latest session did not come with standout turnover.
Key Levels & Scenarios
The immediate ceiling is clear: 393.30 is now the key near-term reference, with the upper Bollinger band at 399.33 and the 3-month high at 398.88 forming a tight resistance zone overhead. If PANW can move through that area, the chart would be signaling that the stock is no longer just testing the top of its range but potentially entering price discovery above the recent high.
On the downside, the first major support to watch is 328.48. That is the line that would matter if the current advance loses traction. A softer but still important reference is the SMA20 at 357.06, which also matches the Bollinger middle band. If the stock slips back toward that zone, it would suggest the latest push is fading into a routine retracement rather than a trend break.
The practical signal from the chart is simple: strength remains intact while the stock holds above the moving averages, but the current position near the top of the range leaves less room for error. The market is rewarding the trend, yet it is also asking whether buyers can keep paying up after such a fast move.
Technical Verdict: HOLD (wait & see)
HOLD (wait & see)
- MACD remains positive, which supports the broader uptrend.
- RSI is neutral, but Stochastic is overbought, warning that the move is extended in the short term.
- Price is near the upper Bollinger band and close to the 3-month high, so upside is possible but less clean from here.
Verdict invalidated if price falls below 357.06, which would mean the stock has slipped back under the SMA20 and the Bollinger midline.
- Ideal Entry Range: 357.06 to 371.76
- Exit Target: 393.30 to 399.33
- Stop Loss Protection: 328.48
In plain English: the chart still looks strong, but after a fast climb, it makes sense to wait for either a pause or a cleaner breakout before the next move becomes easier to trust.
“Right now, the stock is strong — but strong enough to make the next step feel expensive.”
Summary Data PANW
| Last price | 393.30 USD |
| Change 1 day / 5 days / 1 month | 5.79% / 4.85% / 12.08% |
| Trend / MA-cross | uptrend / none |
| SMA20 / SMA50 | 357.06 / 354.96 |
| RSI (14) / Stochastic %K | 62.5 / 99.7 |
| Bollinger %B / ATR | 93% / 19.36 |
| Support / Resistance 20 days | 328.48 / 393.30 |
| Data as of | 23 September 2026 20:30 WIB |

