American Electric Power (AEP) Stock Slides 2.61%: Down 1.5% in Five Sessions
Technical analysis of AEP stock on November 17, 2026: price 125.97 USD, trend sideways, RSI 45.1, support 125.97, resistance 130.64.

Why AEP is in focus today
- One-day move of 0.00%, about 0.0× its average daily range (ATR)
Selected automatically from 4 NASDAQ (US) stocks by a technical-signal score with daily weighted randomisation — not a recommendation.
Trend & Price Action
AEP is holding above its 50-day average, which is the classic "pullback within an uptrend" configuration the technical signals flag as bullish. The 20-day average remains above the 50-day, another constructive structural marker. Yet no new moving-average cross has formed, so there is no fresh golden-cross confirmation to lean on — this is an existing trend being tested, not a new one being born. As shown in the chart, price is pressing against the lower Bollinger band at 126.22 USD, with the band midline at 128.83 and the upper band at 131.43. The %B reading of -5% means the close has actually pushed below the lower band — a technical stretch, not a routine dip. Combined with the day's -2.61% decline, that signals selling pressure has run ahead of the band's statistical envelope.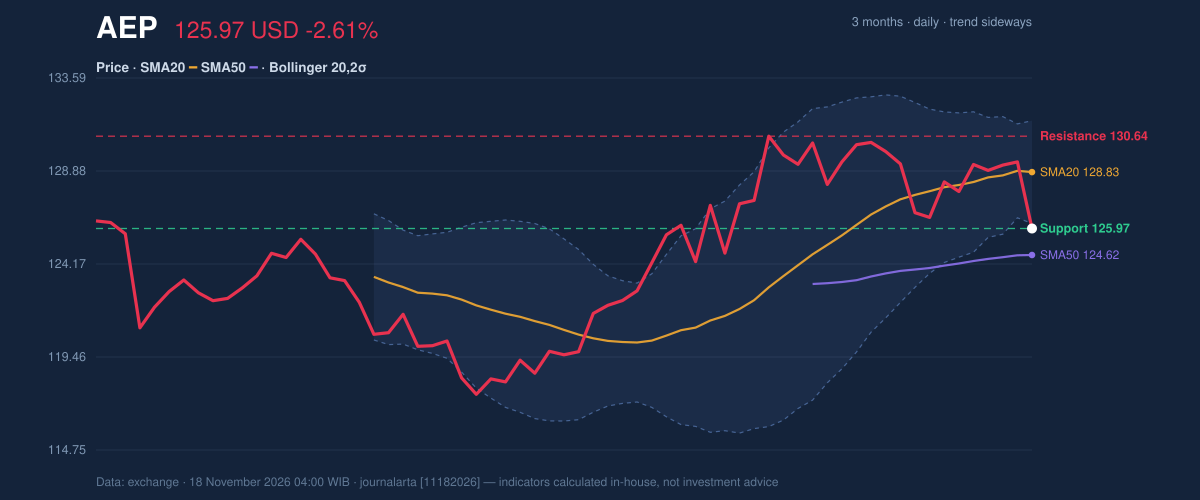
Oscillators & Momentum
Momentum is where the caution lies. RSI at 45.1 is neutral — not oversold, not overbought — so it neither confirms the pullback as a buying opportunity nor warns of exhaustion. Stochastic tells a more interesting story: %K at 26.6 against %D at 52.6 shows fast momentum diving below the slow line, a bearish short-term cross that has not yet reached oversold territory.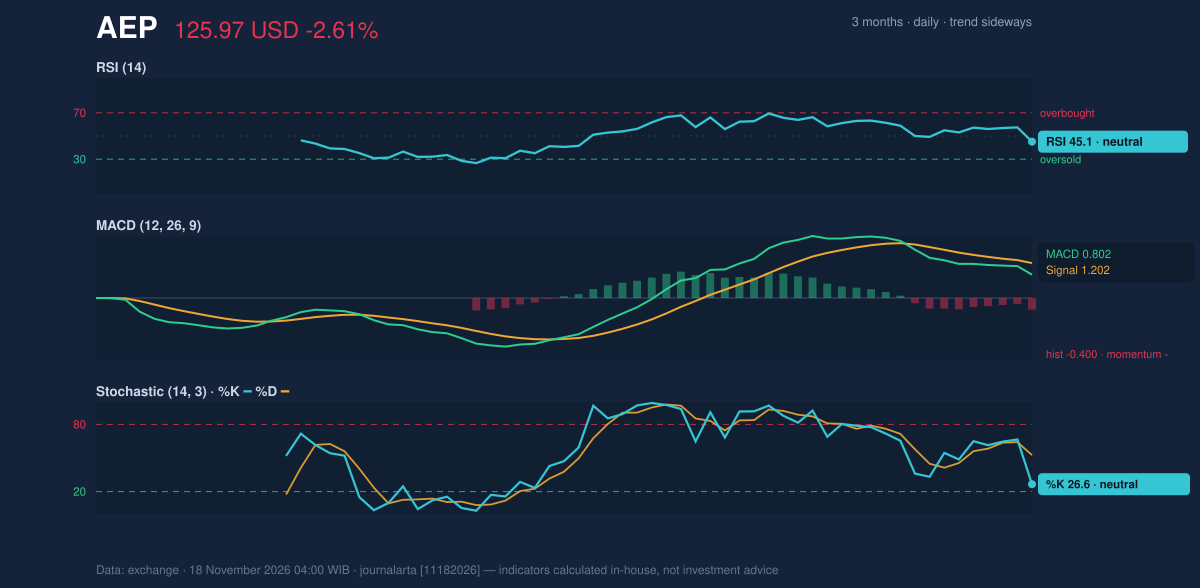
Volatility & Scenarios
Bollinger band width has narrowed to 4.0%, a squeeze condition that typically precedes an expansion move. ATR of 2.91 USD is 2.3% of the price — moderate volatility. Put together, the squeeze says the market is coiling, not confirming. The bearish technical signal on record — "Bollinger squeeze resolved with a close below the lower band" — is exactly what Tuesday's session delivered, which is why the setup can't be upgraded yet. The reference levels lay out the conditional paths. On the upside, a close above the 20-day resistance at 130.64 USD would reopen the path toward the three-month high at 132.17 USD. On the downside, a break of the 20-day support at 125.97 USD — today's exact close — would expose the price minus 1.5×ATR level at 121.60 USD, with the 50-day average at 124.62 in between as an interim floor. The upside target from the ATR math sits at 130.34 USD, just shy of the resistance line, meaning resistance and the statistical upside target nearly coincide.Technical Verdict: HOLD (wait & see)
HOLD (wait & see). The case rests on three points: the price remains above a rising 50-day average with the 20-day above it, keeping the structural trend intact; the pullback to SMA20 support is the textbook bullish configuration flagged in the signals; but MACD is negative, Stochastic has crossed down, OBV is falling, and the squeeze resolved to the downside. Trend and momentum are not aligned — hence patience rather than action. The verdict is invalidated if price closes decisively below 125.97 USD. - Upside entry scenario: a close above 20-day resistance 130.64 USD, targeting the 3-month high at 132.17 USD, with a stop back below the 20-day average at 128.83 USD. - Downside scenario: a break of support at 125.97 USD, with the next reference at 121.60 USD and the 50-day average at 124.62 as the first line to watch. - Stop protection reference: 121.60 USD (price minus 1.5×ATR). In plain terms: the long-term trend still looks healthy, but the short-term signals are pointing down, so the chart is asking for confirmation before it commits either way.| Indicator | Reading | Signal |
|---|---|---|
| Last Price | 125.97 USD | On 20-day support |
| 1-Day / 5-Day / 1-Month | -2.61% / -1.46% / -0.98% | Mild pullback |
| SMA20 / SMA50 | 128.83 / 124.62 | Below SMA20, above SMA50 |
| RSI(14) | 45.1 | Neutral |
| Stochastic %K / %D | 26.6 / 52.6 | Bearish cross, not oversold |
| MACD / Signal / Histogram | 0.802 / 1.202 / -0.400 | Negative momentum |
| Bollinger %B / Width | -5% / 4.0% | Below lower band, squeeze |
| ATR(14) | 2.91 (2.3%) | Moderate volatility |
| Volume vs 20-day avg | 4,532,900 (1.1×) | Above-normal, OBV falling |
| Resistance / Support | 130.64 / 125.97 | Range boundaries |
| 3-Month High / Low | 132.17 / 116.71 | Wide envelope |
| Research Score | +38 (HOLD) | Below +60 buy threshold |
Summary Data AEP
| Last price | 125.97 USD |
| Change 1 day / 5 days / 1 month | -2.61% / -1.46% / -0.98% |
| Trend / MA-cross | sideways / none |
| SMA20 / SMA50 | 128.83 / 124.62 |
| RSI (14) / Stochastic %K | 45.1 / 26.6 |
| Bollinger %B / ATR | -5% / 2.91 |
| Support / Resistance 20 days | 125.97 / 130.64 |
| Data as of | 18 November 2026 04:00 WIB |
| JournalArta research verdict (score) | Hold (+38) |
Today's full Buy and Sell list for US stocks →
Disclaimer: This technical analysis is generated automatically from exchange data and indicators calculated by JournalArta, for information and education only. The verdict and the entry, target and stop-loss levels are not investment advice or a solicitation to buy or sell any security. Investment decisions and their risks rest solely with the reader.
Track AEP stock price daily: live levels, support/resistance and our full AEP analysis history.
 Take the quizWhat Kind of Holiday Spender Are You? Take the Black Friday QuizStart →
- 1U.S. Emergency Alert Test Nov. 17 Is Not a Power Outage

- 2DUP Chairman Lord Morrow Loses Wife and Daughter Within Hours in NI

- 3NASA’s Curiosity Rover Burst Open a Rock and Found Pure Sulfur

- 4Women With Autoimmune Diseases Wait About 4 Years for Diagnosis, Study Finds

- 5Stock Market Today: Dow Futures Slip as Nasdaq Futures Climb Before Earnings

 Lifestyle · Food & Health4 Reasons to Eat Oatmeal, According to Nutrition Experts
 Lifestyle7 Signs Your Social Battery Is Running Low (and Why You Keep Cancelling Plans)
 Lifestyle · Food & HealthThanksgiving Food Safety: How Long Leftovers Last and the Safe Turkey Temperature
 Lifestyle7 Quiet Habits of Emotionally Intelligent People, According to Psychologists