AstraZeneca Stock Technicals Today: Drops 3.66%, Testing Support Level
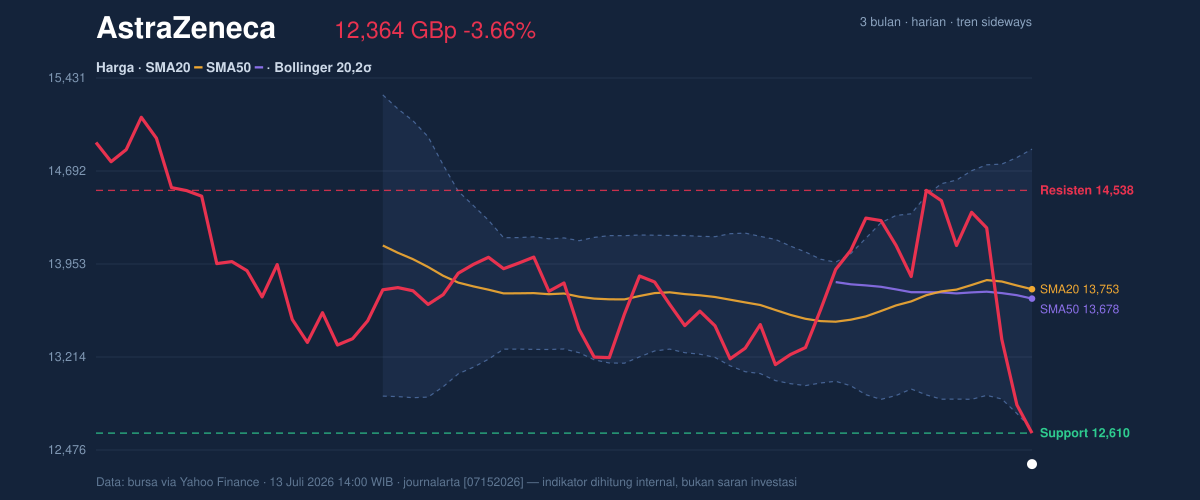
Technical analysis of AstraZeneca stock on Juli 15, 2026: price 12,364.00 GBp, trend sideways, RSI 34.1, support 12,610.00, resistance 14,538.00.

AstraZeneca (AZN.L) shares faced a sharp recalibration on the London Stock Exchange, closing at 12,364.00 GBp, a single-session decline of 3.66% that ripples through a broader five-day slide of 12.31%. This rapid contraction in market value leaves the stock trailing significantly below its key moving averages, signaling a period of intense pressure for the pharmaceutical giant as participants digest the recent downward momentum.
Trend & Price Action
The technical landscape for AstraZeneca is currently defined by a breakdown below its foundational support structures. With the price now sitting at 12,364.00 GBp, it has drifted well beneath both the SMA20 (13,753.10 GBp) and the SMA50 (13,678.24 GBp). Because the price has effectively breached the Bollinger Band lower threshold of 12,640.76 GBp, the current %B of -12% suggests an extreme departure from the mean. This breach of the lower band often serves as an early indicator of exhaustion, though it does not necessarily imply an immediate pivot without further volume confirmation.
Oscillators & Momentum
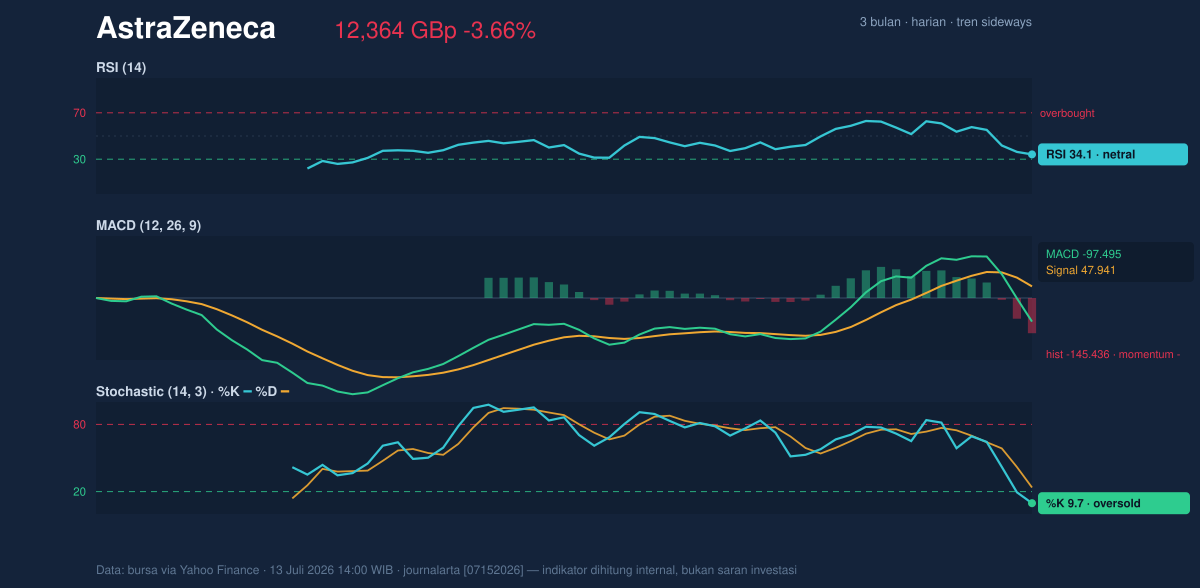
While the price remains under heavy fire, the internal momentum gauges provide a more nuanced narrative. The RSI (14) at 34.1 sits just outside of traditional oversold territory, yet the Stochastic %K at 9.7 offers a more aggressive signal, confirming that the stock is currently in oversold conditions. However, the MACD reading of -97.495 remains firmly beneath the signal line, with a negative histogram of -145.436, illustrating that the primary trend strength is dominated by sellers. As shown in the chart, the divergence between the deeply oversold Stochastic and the bearish MACD suggests that while the downside may be overextended, the trend momentum has yet to turn bullish.
Volatility & Volume
Market participants are showing increased urgency; volume of 2,741,916 remains consistent with the 20-day average, yet the OBV (On-Balance Volume) is trending downward, indicating that selling pressure is supported by actual institutional outflows rather than mere noise. The ATR (14) of 590.57, representing approximately 4.8% of the share price, highlights a state of high volatility. When volatility expands to this degree, price ranges become violent, necessitating wider parameters for any risk management strategy.
Key Levels & Scenarios
AstraZeneca is currently trading at a distance from its 20-day resistance at 14,538.00 GBp, effectively testing the patience of holders. The immediate focus rests on the 20-day support of 12,610.00 GBp; should the price fail to reclaim this level with conviction, the volatility represented by the ATR suggests further testing of the lower bounds toward the three-month low of 11,232.00 GBp. Conversely, a reversion toward the SMA20 would require a significant influx of buying volume to neutralize the current negative MACD histogram.
Technical Verdict: HOLD (wait & see)
* Oversold Stochastic: The indicator suggests the stock is statistically overextended to the downside.
* Negative Momentum: MACD and OBV confirm that despite the oversold state, there is no active buying catalyst to support a reversal yet.
* Invalidation: This neutral outlook is invalidated if the price closes decisively below the 12,000.00 GBp psychological floor.
* Ideal Entry Range: 11,800.00 – 12,100.00 GBp
* Exit Target (Target Price): 13,750.00 GBp
* Stop Loss Protection: 11,150.00 GBp
The current technical configuration suggests that while the stock is priced for a potential bounce due to extreme oversold signals, the lack of structural support and bearish volume flow warrants waiting for a stabilization of the daily trend before committing capital.
AstraZeneca’s current volatility as measured by the ATR indicates a daily price movement potential of nearly 600 points.
Summary Data AstraZeneca
| Last price | 12,364.00 GBp |
| Change 1 day / 5 days / 1 month | -3.66% / -12.31% / -6.33% |
| Trend / MA-cross | sideways / none |
| SMA20 / SMA50 | 13,753.10 / 13,678.24 |
| RSI (14) / Stochastic %K | 34.1 / 9.7 |
| Bollinger %B / ATR | -12% / 590.57 |
| Support / Resistance 20 days | 12,610.00 / 14,538.00 |
| Data as of | 13 Juli 2026 14:00 WIB |



