PANW Stock Gains 6.84% Today, Testing Key Resistance
Technical analysis of PANW stock on Juli 15, 2026: price 352.89 USD, trend uptrend, RSI 66.0, support 279.90, resistance 357.53. Key angle: PANW Stock Gains.

Palo Alto Networks (PANW) surged by 6.84% to reach a last price of 352.89 USD, reflecting a decisive shift in market sentiment as the stock tests its upper resistance thresholds. The cybersecurity leader is currently riding a wave of aggressive buying, characterized by a 1-month gain of 26.20% that has decoupled the stock from its mid-year consolidation patterns.
Volatility is expanding.
Trend and Price Action
The stock is currently exhibiting a strong structural uptrend, trading comfortably above the SMA20 of 316.50 and the SMA50 of 273.54. With the SMA20 slope rising at 5.30% over 5 days, the momentum is clearly aggressive. The current price level sits at approximately 94% of the range between the 20-day support of 279.90 and the 20-day resistance of 357.53.
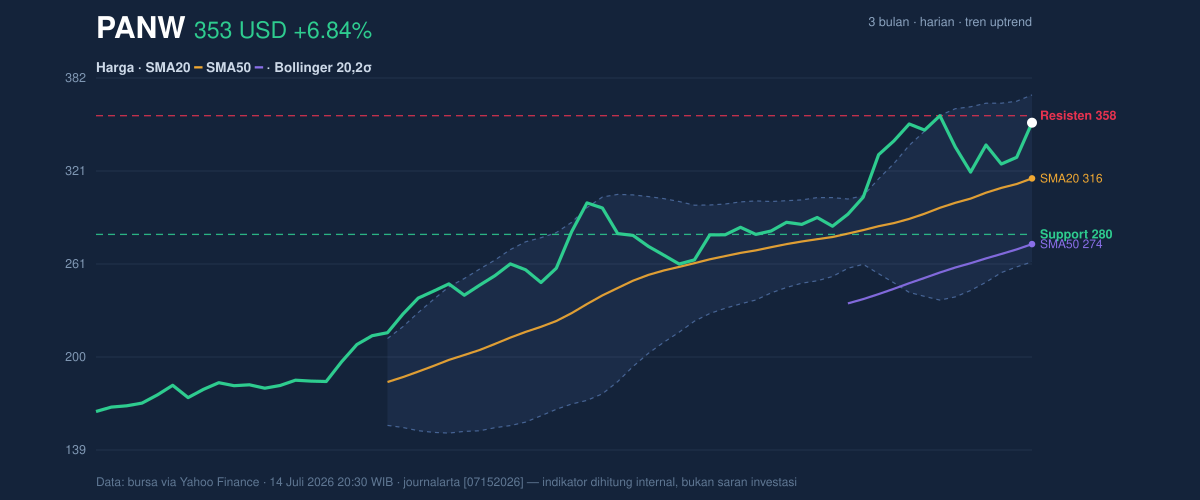
As shown in the chart, the price is nearing the Bollinger upper band of 371.09, a classic indicator that the asset is testing the limits of its current distribution channel. The Bollinger bandwidth of 34.5%—signaling a recent expansion—combined with an ATR(14) of 18.48, suggests that price swings of over 5% are becoming the new baseline, requiring investors to account for significant intraday turbulence.
Momentum and Oscillators
The technical picture for PANW is a blend of strength and caution. The RSI(14) at 66.0 sits in neutral territory, avoiding the "overbought" label above 70, which provides further room for growth. However, the Stochastic %K of 81.8 versus the %D of 62.7 indicates an overbought condition, suggesting that short-term buyers are becoming aggressive and potentially exhausting the immediate upside.
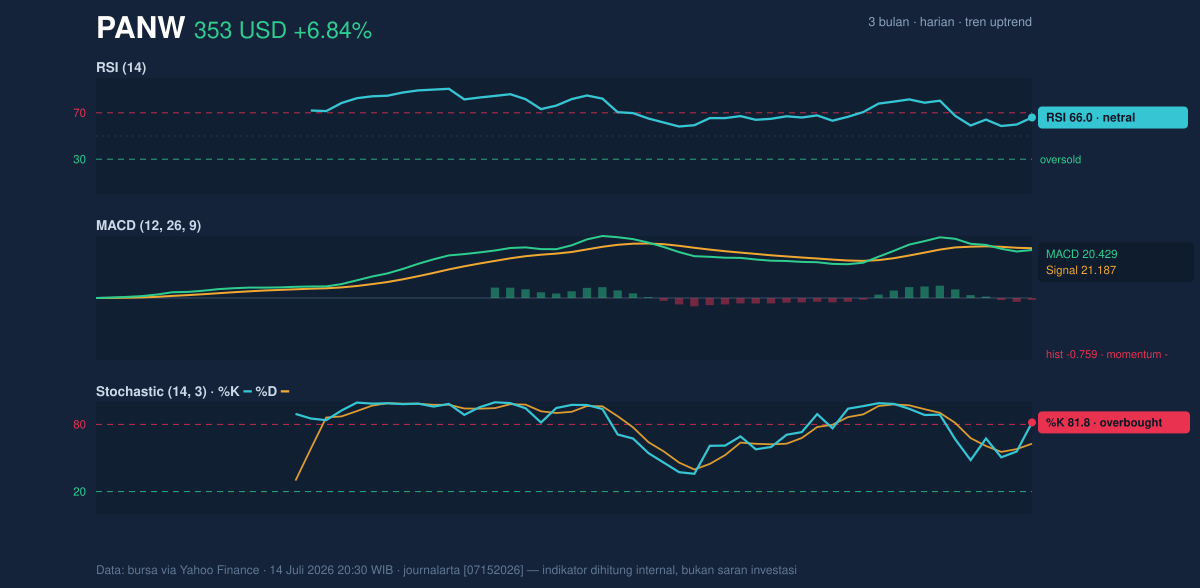
Furthermore, the MACD value of 20.429 is slightly below its signal line of 21.187, resulting in a negative histogram of -0.759. This divergence is a critical signal: while the price is climbing, the underlying momentum is not confirming the strength of the rally at the same velocity, indicating that the current move may be prone to a cooling-off period rather than a breakout.
Volume and OBV
Participation remains a point of intrigue. While the OBV (On-Balance Volume) is trending upward, confirming that accumulation is active, the recent volume of 6,010,100 shares is only 0.8x the 20-day average. This suggests that the current price appreciation is occurring on relatively thin participation, which can sometimes lead to sharp, reflexive pullbacks if conviction waivers at key resistance levels.
Key Levels & Scenarios
The immediate focus is the 357.53 resistance level. A sustained move above this point would likely draw interest toward the 3-month high of 368.17. Conversely, should the stock fail to penetrate this ceiling, the SMA20 at 316.50 becomes the primary psychological and structural floor to watch for re-entry.
Technical Verdict: HOLD (wait & see)
The technical outlook for PANW is characterized by high volatility and a momentum divergence that suggests the current rally may need to digest its gains before further expansion.
* Reasons for Hold: The negative MACD histogram coupled with a Stochastic overbought signal suggests limited short-term upside potential, while the sub-average volume fails to fully validate the recent 6.84% jump.
* Invalidation Condition: This neutral outlook is invalidated if the price clears the 357.53 resistance on volume exceeding the 20-day average, signaling a breakout attempt toward the 3-month high.
* Technical Ranges:
* Entry Range: 316.50 – 325.00
* Exit Target (Resistance): 357.53 – 368.17
* Stop Loss Protection: 279.90
This analysis serves as an observation of current market patterns and does not constitute financial advice. The stock is currently in a state of high-beta expansion, where the speed of the recent move may require a consolidation phase to attract more sustainable volume.
Summary Data PANW
| Last price | 352.89 USD |
| Change 1 day / 5 days / 1 month | 6.84% / 4.70% / 26.20% |
| Trend / MA-cross | uptrend / none |
| SMA20 / SMA50 | 316.50 / 273.54 |
| RSI (14) / Stochastic %K | 66.0 / 81.8 |
| Bollinger %B / ATR | 83% / 18.48 |
| Support / Resistance 20 days | 279.90 / 357.53 |
| Data as of | 14 Juli 2026 20:30 WIB |



