CVX Stock Gains 1.91%, Testing Key Resistance In Focus
On Juli 20, 2026: price 187.38 USD, trend sideways, RSI 64.1, support 165.69, resistance 187.38. technical analysis of cvx stock. CVX Stock Gains — full…

Chevron shares climbed 1.91% to $187.38 on the New York Stock Exchange on Thursday, according to exchange data via Yahoo Finance, capping a 6.22% five-day advance that has carried the oil major directly into its 20-day ceiling. The move pushed the stock above its upper Bollinger Band — a statistically stretched position — yet it arrived on noticeably thin trading volume. That combination frames the central question for CVX: a genuine breakout attempt, or a rally running on fumes at resistance.
Trend & Price Action
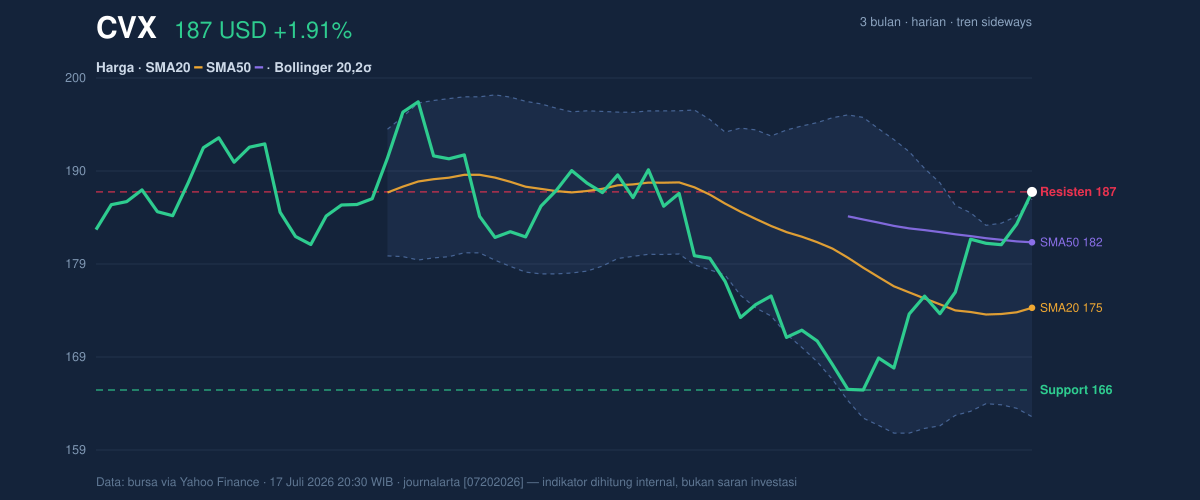
The price structure has improved markedly in a week. CVX now trades above both its SMA20 at $174.69 and SMA50 at $181.86, reclaiming the medium-term average it had lost earlier in the quarter. Officially, however, the trend remains classified as sideways — the SMA20's slope is a near-flat 0.16% over five days, and no fresh moving-average crossover has formed. In plain terms, the recovery is real but young; the averages have not yet bent upward to confirm a new uptrend.
What stands out is where the stock closed: exactly at the 20-day resistance of $187.38, or 100% of its recent range, as shown in the chart. The Bollinger %B reading of 103% confirms the close landed above the upper band at $186.61 — a sign of aggressive buying, but also a level where prices statistically spend little time. Within the broader three-month picture, bounded by $164.78 below and $198.87 above, CVX has recovered most of its lost ground yet still trades roughly 6% below that quarterly peak.
Oscillators & Momentum
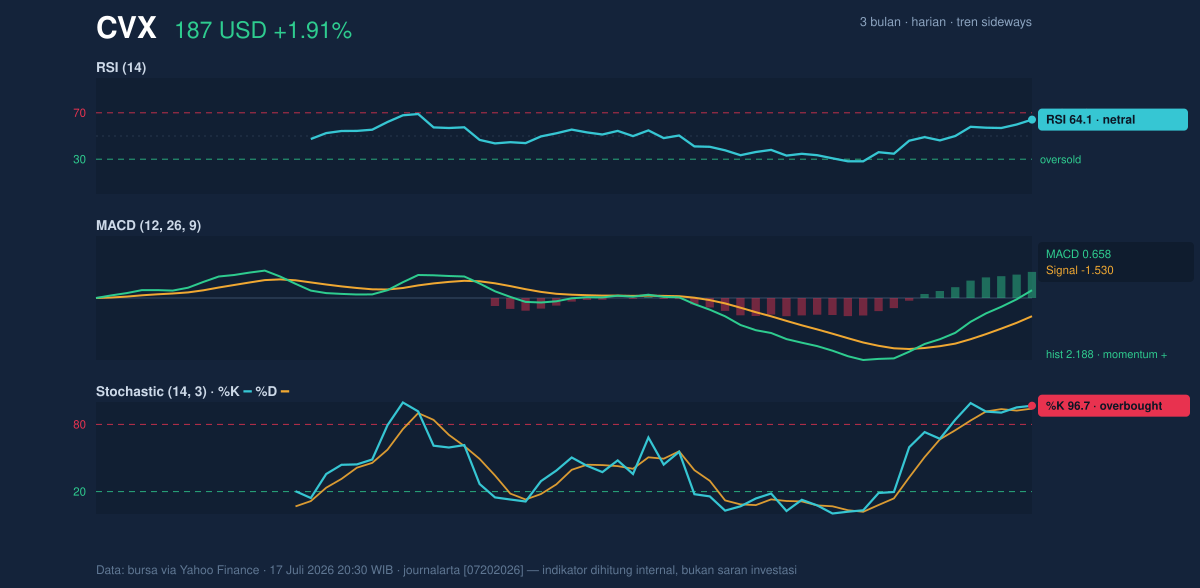
Momentum indicators are sending a split message, and the split matters. The MACD has crossed decisively into positive territory — the line at 0.658 sits well above its signal at -1.530, with a histogram of +2.188 — telling us the underlying thrust of the move is accelerating, not fading. The RSI at 64.1 remains neutral, comfortably below the 70 mark that typically flags exhaustion, meaning trend-followers still see headroom.
The Stochastic oscillator disagrees. With %K at 96.7 and %D at 94.1, it sits deep in overbought territory, the zone where short-term pullbacks historically begin. This is a classic late-stage-rally signature: the fast oscillator says the market has already paid for the good news, while the slow one says the trend is just turning.
Volatility & Volume
Volatility conditions are orderly. The ATR of $3.80, roughly 2.0% of the share price, implies daily swings that are meaningful but not chaotic, and the Bollinger band width of 13.6% is normal — no squeeze, no panic expansion. The rally is a genuine repricing rather than a volatility event.
Volume is the weak link. Thursday's 7.05 million shares amounted to just 0.7× the 20-day average of 9.61 million. Breakouts that travel to resistance on shrinking participation fail more often than they succeed, because fewer buyers are needed to reverse them. The one offsetting signal: On-Balance Volume is still rising, suggesting cumulative accumulation continues beneath the surface even as headline turnover fades.
Key Levels & Scenarios
The map is clean. Above, resistance sits at $187.38 — being tested now — followed by the three-month high at $198.87. Below, first support is the SMA50 at $181.86, then the SMA20 at $174.69, with the 20-day floor at $165.69 and the lower Bollinger band at $162.77.
Two conditional paths follow. If CVX closes above $187.38 with volume returning toward its average, the chart opens toward $198.87. If it is rejected and loses $181.86, a retrace toward $174.69 becomes the higher-probability route.
Technical Verdict: HOLD
HOLD (wait & see) — the indicators argue for patience rather than pursuit:
- Bullish bias, wrong location: MACD momentum is positive and price holds above both SMAs, but the stock is pinned at 100% of its range with Stochastic overbought at 96.7 — chasing at the ceiling offers poor risk-reward.
- Unconfirmed breakout: %B at 103% above the upper Bollinger Band on only 0.7× average volume is participation divergence, not confirmation.
- Invalidation: this neutral stance flips bearish if price falls below $165.69, the 20-day support; a high-volume close above $187.38 would upgrade the picture to bullish continuation.
Levels for traders working the setup:
- Entry range: $174.69–$181.86 on a pullback into the SMA20–SMA50 zone, or a confirmed close above $187.38 with volume at or above the 20-day average
- Exit target: $198.87 (three-month high)
- Stop loss: below $165.69 (20-day support)
In plain English: Chevron is knocking on a ceiling, and the evidence says wait to see whether the door opens rather than paying ceiling prices today.
The next session's test is straightforward — whether CVX can post a close above $187.38 with turnover returning toward its 9.6 million-share average, the confirmation the volume data says is still missing.
Summary Data CVX
| Last price | 187.38 USD |
| Change 1 day / 5 days / 1 month | 1.91% / 6.22% / 5.52% |
| Trend / MA-cross | sideways / none |
| SMA20 / SMA50 | 174.69 / 181.86 |
| RSI (14) / Stochastic %K | 64.1 / 96.7 |
| Bollinger %B / ATR | 103% / 3.80 |
| Support / Resistance 20 days | 165.69 / 187.38 |
| Data as of | 17 Juli 2026 20:30 WIB |


