PG Stock Drops 1.00% Today, Momentum Weakens
On Juli 20, 2026: price 149.98 USD, trend sideways, RSI 53.2, support 146.08, resistance 152.75. technical analysis of pg stock. PG Stock Drops — full details…

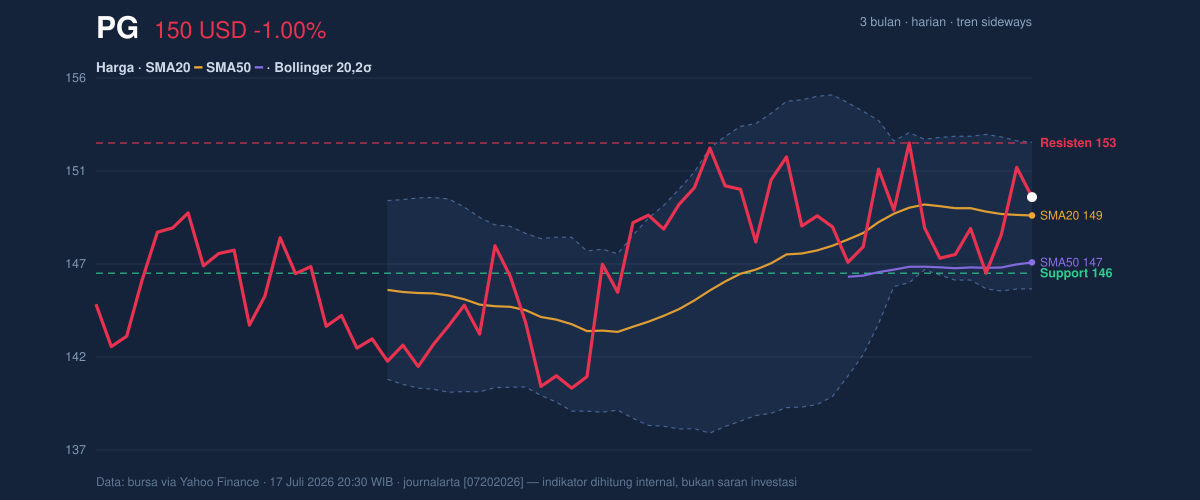
Procter & Gamble shares fell 1.00% to $149.98 in the latest session, handing back roughly half of a 2.00% five-day gain, according to exchange data via Yahoo Finance as of 17 July 2026. The daily dip, however, is not the story. The story is compression: PG's Bollinger bands — volatility boundaries plotted two standard deviations above and below the 20-day average — have narrowed to a width of just 5.0%, a configuration technicians call a "squeeze." Squeezes resolve into breakouts. The only question the data leaves open is which way.
Trend & Price Action: Flat, But Not Weak
The official trend reading is sideways, with the 20-day simple moving average sloping at a negligible -0.25% over five days — a line that is effectively horizontal. Yet the price structure underneath carries a mild upward bias. PG is trading above both its SMA20 at $149.04 and its SMA50 at $146.63, meaning the stock sits on top of its own short- and medium-term cost bases rather than beneath them. No new moving-average cross has formed, so neither bulls nor bears hold a confirmed structural signal.
Within the 20-day range, price sits at 58% of the span — upper half, but not stretched. The Bollinger %B reading of 63% confirms that: PG is trading closer to the top of its band than the bottom, without pressing into the kind of extreme territory that invites mean reversion. Against the three-month window — a high of $154.32 and a low of $138.86 — the stock is parked in the upper-middle of a wide corridor, digesting rather than trending.
Momentum: A Quiet Disagreement With the Rebound
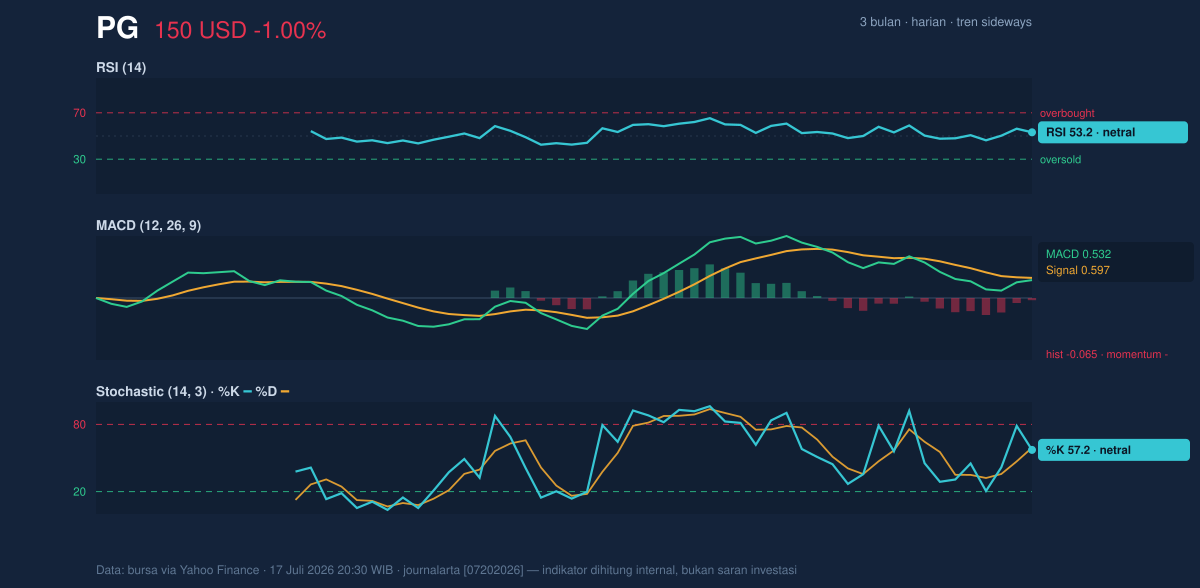
Here is where the picture gets interesting — and where the five-day rally loses some credibility. The RSI(14) at 53.2 is dead neutral, offering no overbought or oversold edge. The Stochastic oscillator (%K 57.2 against %D 59.2) has produced a minor bearish crossover inside neutral territory: the fast line has slipped below the slow line, a small sign that upside thrust is cooling.
The more telling signal comes from the MACD. The MACD line sits at 0.532, below its signal line at 0.597, with the histogram at -0.065. In plain terms: the short-term momentum engine is running slightly in reverse even as price holds firm. When price stays stable but the momentum gauge quietly rolls over, the burden of proof shifts to the buyers.
Volatility & Volume: The Squeeze Meets Shrinking Participation
Average true range — a measure of how far the stock typically travels in a day — stands at 3.48 points, or 2.3% of the share price. That is moderate volatility for a defensive name like PG, and it gives traders a yardstick: a "normal" day swings the stock roughly $3.50.
The squeeze changes that calculus. When Bollinger bands pinch to 5.0% width, the market is storing energy; historically, the tighter the coil, the sharper the eventual release.
Volume, though, refuses to confirm anything yet. The latest session printed 8,912,000 shares against a 20-day average of 9,895,880 — just 0.9 times normal participation. More pointedly, on-balance volume is falling, meaning cumulative money flow is drifting out of the stock even as the price holds its ground. That is a mild distribution footprint: patient sellers using quiet sessions to reduce exposure.
Key Levels & Scenarios
The battlefield is tightly drawn. On the downside, support sits at $146.08, reinforced almost immediately by the SMA50 at $146.63 just above it — together forming a $146.08–$146.63 demand zone. Below that, the lower Bollinger band at $145.28 is the last technical floor before the chart opens up toward the three-month low region.
On the upside, resistance at $152.75 and the upper band at $152.80 create a confluence ceiling — two independent barriers stacked within five cents of each other. Ceilings like that either repel price firmly or, once broken, flip into launchpads. A decisive close above $152.80 with expanding volume would put the three-month high at $154.32 in play. A failure to hold the $146.08–$146.63 zone would hand control to the sellers and expose $145.28.
Technical Verdict: HOLD
HOLD (wait & see)
The strongest reasons, straight from the dashboard:
- The Bollinger squeeze (5.0% width) signals a coming move but gives no directional confirmation — acting before the breakout is guessing, not analyzing.
- MACD histogram at -0.065 shows momentum quietly fading beneath a stable price, contradicting the bullish case.
- Falling OBV on 0.9× average volume shows participation draining away — neither side has committed enough capital to trust a directional call.
Invalidation: the neutral stance breaks down if price falls below $146.08, which would turn the bias bearish toward $145.28. On the other side, a close above $152.80 would flip the setup constructive.
Technical levels for those tracking the chart:
- Entry Range: $146.10–$146.60 (the support/SMA50 zone, only on evidence it holds) — or above $152.80 on a confirmed breakout close
- Exit Target: $152.75–$152.80, with an extended target at $154.32 (the three-month high)
- Stop Loss: below $145.28, the lower Bollinger band, to cap risk if the floor gives way
In plain English: PG is a coiled spring — the data says let it release before forming a view, because the corridor it has respected for a month, $146.08 to $152.75, is only $6.67 wide.
Summary Data PG
| Last price | 149.98 USD |
| Change 1 day / 5 days / 1 month | -1.00% / 2.00% / -0.39% |
| Trend / MA-cross | sideways / none |
| SMA20 / SMA50 | 149.04 / 146.63 |
| RSI (14) / Stochastic %K | 53.2 / 57.2 |
| Bollinger %B / ATR | 63% / 3.48 |
| Support / Resistance 20 days | 146.08 / 152.75 |
| Data as of | 17 Juli 2026 20:30 WIB |


